Process Image Screen Component
Description
Appway lets live Process information be displayed as an image in the web browser. To achieve this, Appway provides a predefined Widget (draggable, high-level visual screen element).
A Widget refers to a prefabricated element which can be used to implement/assemble a Screen or HTML page.
The Process Image Widget is dragged into the Screen Editor and configured. Configuration options are explained in detail below.
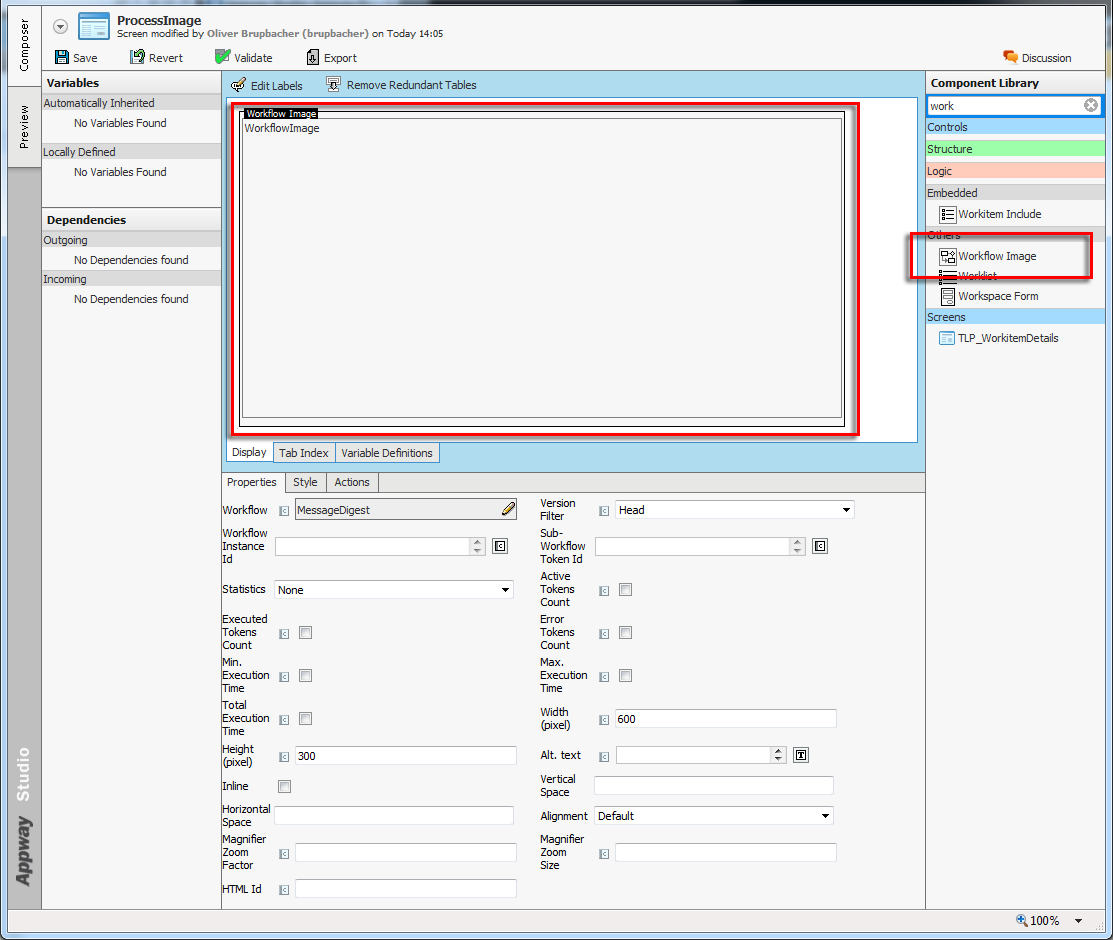
Figure 1: The Screen Editor with one Widget
Configuration Parameters
Available options on the Properties tab are:
- Process – Choose a predefined Process from your model to be displayed as an image on your screen.
- Version Filter – Appway's Business Objects are versioned. This configuration offers the possibility of choosing from all available functions.
- Process Instance Id – The Process Instance ID points to the Root element of a Process.
- Subprocess Token Id – Tokens are attached to a Process Instance. Process Instances can have one or multiple Tokens depending on the complexity of a Process.
- Statistics – Statistics of the Process can be displayed. Appway provides two options:
Live Processes: This displays the status of the Process as it is right now.
Process Log: This displays the amount of already executed Process. Caution. depending on the size of the collected Process data, this can take a while to process. To collect Process Data (Statistics) the Process Statistics must be enabled.
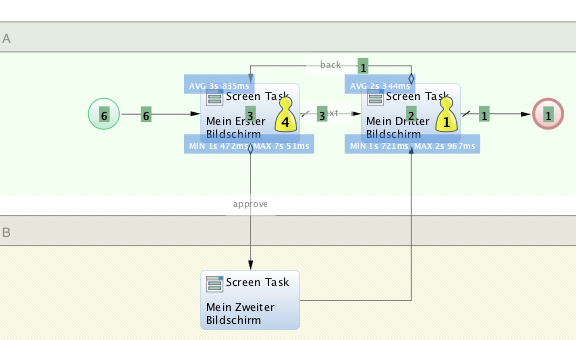
Figure 2: Process Log
- Active Tokens Count – If the checkbox is selected, the Process Image displays the yellow tokens including the count (amount of tokens waiting for execution on the Task)
- Executed Tokens Count – If the checkbox is selected and Statistics is set to Process Log, the Process Image will display the Executed Tokens Count as green labelsn
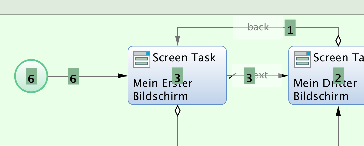 nFigure 3: Executed Tokens
 - Execution Time – A Token resides on a Task for a certain amount of time. When the option Statistic is set to Process Log, the Minimum, Maximum and Average execution time can be displayed.n
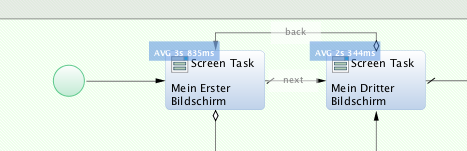 nFigure 4: Average Execution Time
 - Error Tokens Count – Similar to Active Tokens Count; if the checkbox is selected, the Error Tokens will be displayed in red.
Available options on the Appearance tab are:
- Width and Height – Controls the size of the Process Image in pixels. The Process Diagram will be fitted into the width and height dimensions without losing its own aspect ratio.
- Inline (DEPRECATED) – This option controls the flow of the next elements if Inlined with Text.nMore control over how the Process Image is displayed in relation to the text are provided by the options 'Vertical Space and Horizontal Space'
- Alt. Text – Text pop-up displayed when rolling over the image with the cursor.
- Vertical/Horizontal Space (DEPRECATED) – These two options correspond to the HTML Attributes used to align Images and Text 'vspace and hspace' These options only work when used with the Inline options
- Alignment (DEPRECATED) – Alignment also refers to the Inline options and supports the correct alignment to the surrounding Text
- Magnifier Zoom Factor – Defines the Maginifcation Factor and provides a magnifying glass.nCaution: Choosing a large magnification factor results in a large Process Image. This could affect the Memory Usage of Appway.nRecommended zoom factors are 2, 2.5, or 3.nNote: The Process Image is scaled by the browser and can therefore be of inconsistent quality depending on the browser in use.
- Magnifier Zoom Size – Defines the size of the square magnifier glass.