Debugging Techniques
Introduction
While creating a business Solution in Appway, you might encounter various issues, e.g., a checkbox in a Screen is not checked when it should be, a Process never appears in the correct user's inbox, or a Script does not execute at all.
Most of these bugs can be fixed easily using a few simple techniques. In this article, we'll show you how to identify, localize and fix bugs in your business application.
This article is structured by Business Object. It's probably a good idea to read through the whole article; but if need a fix for a specific problem quickly, you need to start out by thinking about which Business Object the issue occurs in. For example, if you suspect the error occurs in a Screen, start out by going to the chapter on Screens.
Processes
Debugging using Breakpoints
You can use the built-in Appway Debugger to set breakpoints and debug your Solution.
Debugging using the LOGGER() Function
In larger Processes, it can be hard to find out why a Process took a specific turn. To trace a Process's path, you can add LOGGER() commands to its script.
Consider the following part of a Process. From the XOR gateway, the Process can take two separate paths. There's a Conditional connection and a Default connection:
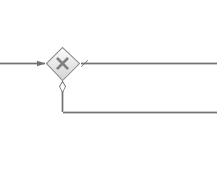
The Conditional connection contains this script:
$currentAccountManager > 0
Let's assume that our Process does not take the path we expect. In order to figure out why that is the case, it would be useful to know what $currentAccountManager actually contains. To find this out, change the Conditional connection's condition script to:
LOGGER('debug', JOIN('Node "next account manager",
$currentAccountManager=',$currentAccountManager),
'com.nm.mylogger.workflow.ExpenseProcess');
Return $currentAccountManager > 0;
We've added a call to the LOGGER() function, which will print a message to a custom logger named com.nm.mylogger.workflow.ExpenseProcess. Note that we make sure that the log entry contains information about where the LOGGER() message originates from; this is important if we forget to remove the call to LOGGER(). If you don't point out where a log entry originates, it might become hard to remove unnecessary calls to LOGGER() at a later date.
The following string will be printed to your log:
JOIN('Node \"next account manager\", $currentAccountManager=', $currentAccountManager)
This results into a message looking as follows:
Node "next account manager", $currentAccountManager=0
To see your log output, go to System Maintenance > Logging > Log Viewer and open your newly created log; in our case, the logger name is com.nm.mylogger.workflow.ExpenseProcess.
Using this technique, you can easily see which turns the Process took, and why it did so.
Screens
Scope Debug View
If you suspect that your Screen does not work properly because it does not contain the correct data, you should start out by putting a Scope Debug View Component on your Screen. When rendered, the Scope Debug View will provide a list of your scopes and their variables:
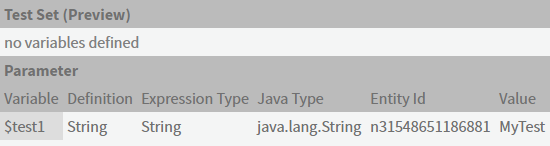
For each variable, you can see its relevant properties. While the Scope Debug View is limited in how deep you can see into your data structure, it provides a good first step when trying to figure out what data your Screen is using.
Debugging with Text Field Components
If the Scope Debug View does not show the expected value, drag a Text Field Screen Component to your Screen and bind it to the expected property. That way, you will see the actual value stored in that property at render time.
Debugging Ajax Update Areas
If your Ajax Update Area does not behave as expected, it can sometimes help to remove the Update Area Action, forcing a redraw of the whole Screen. This way, errors may appear which were previously not visible. Add a Label inside the Update Area containing a random number to see whether and when the Ajax Update Area is being updated. Mark its Text property as an Expression and add this text: RANDOM()
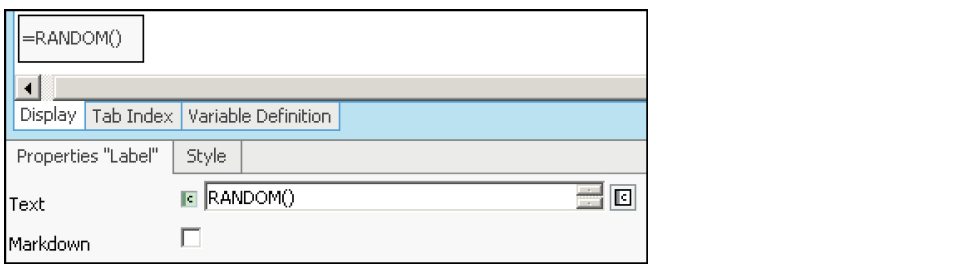
The Label's content will change each time the Ajax Update Area is redrawn.
Common Issues with Screens
Here are a few common issues with Screens, and strategies for dealing with them:
- Screen Scripts are executed in wrong phase, or are not executed at all – Set their Phase property to Always .
- Components where you cannot see the actual value (such as Checkboxes) do not show the state they should – Create a Text Field and bind it to the same value as the Checkbox to see what is actually stored there.
- An Ajax Update Action causes an "Unknown Runtime Error" in Internet Explorer – Make sure all HTML IDs on your Screen are unique.
- Part of your Screen does not show up – Check whether all If Components work correctly; output the results of their Expressions into Label Components to see whether they behave as expected.
PDF Outputs
Debugging using the SCOPETRACETABLE() Function
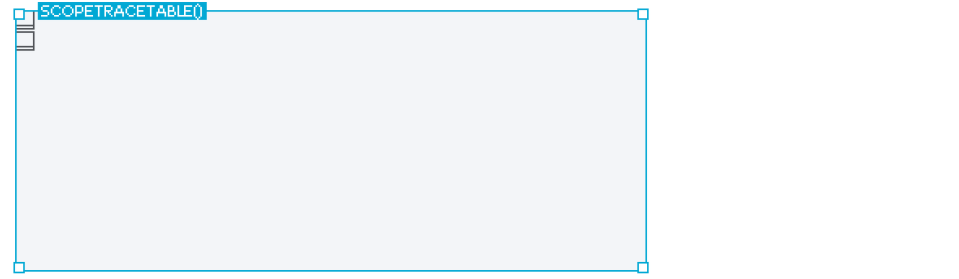
Similar to the Scope Debug View in Screens, you can use the SCOPETRACETABLE() Function in PDF Outputs to get information about currently available variables. Add a new Table field to your PDF Output and set its Expression property to SCOPETRACETABLE()
Your new field should be sufficiently large and look as follows:
Then, save the PDF Output. The next time your PDF Output is rendered, you will see the following:
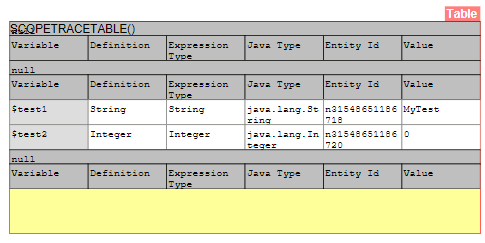
As with the Scope Debug View, this allows you to see the variables which your PDF Output has access to, as well as their properties and their values.
Debugging with Text Fields
If the Table with the SCOPETRACETABLE() Expression does not show you the value you want to see, drop a Text Field on your PDF Output and bind it to the property you are interested in. That way, you will see the actual value stored in that property when rendered.
Scripts
Debugging using Breakpoints
You can use the built-in Appway Debugger to set breakpoints and debug the Scripts.
The Interactive Script Editor
If your Script or Function does not behave as expected, it might be a good idea to let it run in the Interactive Script Editor (ISE). To access the ISE:
- Go to Solution Maintenance > Script Language and select Start Interactive Script Editor from the menu, or
- Use the shortcut CTRL+Shift+I
Paste your Script or Function into the Editor's text area. Keep in mind the following:
- If your Script is copied from within a Business Object and uses that Object's variables, it will not have access to these variables while running in the Interactive Script Editor. You will need to define and instantiate these variables manually at the beginning of your Script.
- If you are debugging a Script Function, you need to remember to turn it into a Script by replacing the Function-specific keywords, and by manually defining and instantiating any arguments your Function may have had.
Now that your Script is adapted to be used in the Interactive Script Editor, simply click on Validate to make sure its syntax is correct, then click on Run. The Script's return value will be added to the upper area of the Interactive Script Editor. For example, if your Script was:
Local Integer $var;

$var := 3;

Return $var;
your Script Output would read:
3
execution took 1ms
In other words, the Script's return value is "3". Click on Clear to remove the current Script's output.
That's quite useful, but what if your Script does not behave as expected? Let's say this is your Script:
Local Integer $var;
$var := 3;
Local Integer $i;
For $i:=1 Condition $i<=10 Step $i:=$i+1 Do
$var := $var + $i;
End
Return $var;
After you run this Script, the Script Output reads:
58
execution took 33ms
Perhaps this is not the result you were expecting, and you are wondering why the Script evaluates to 58. To find out what your Script is doing, add PRINT statements. Here's the same Script with a few PRINT statements which explain what the Script is doing:
Local Integer $var;

PRINT('Set $var to 3\n');

$var := 3;

Local Integer $i;

For $i:=1 Condition $i<=10 Step $i:=$i+1 Do

PRINT(' Set $var to $var + ',$i,'\n');

$var := $var + $i;

PRINT(' $var is now ',$var,'\n');

End

PRINT('Return $var\n');

Return $var;
Note: Don't forget to add newlines ("\n") after each printed string.
This will result in the following Script Output:
Set $var to 3
Set $var to $var + 1
$var is now 4
Set $var to $var + 2
$var is now 6
Set $var to $var + 3
$var is now 9
Set $var to $var + 4
$var is now 13
Set $var to $var + 5
$var is now 18
Set $var to $var + 6
$var is now 24
Set $var to $var + 7
$var is now 31
Set $var to $var + 8
$var is now 39
Set $var to $var + 9
$var is now 48
Set $var to $var + 10
$var is now 58
Return $var

58
execution took 7ms
As you can see, it is now possible to figure what exactly the Script did to arrive at the result of "58".
Debugging using the LOGGER() Function
If you want to debug Scripts or Functions while your Solution is running, use the LOGGER() Function to log your Script's action; wherever you would put calls to PRINT() if you were using the Interactive Script Editor, instead call LOGGER().
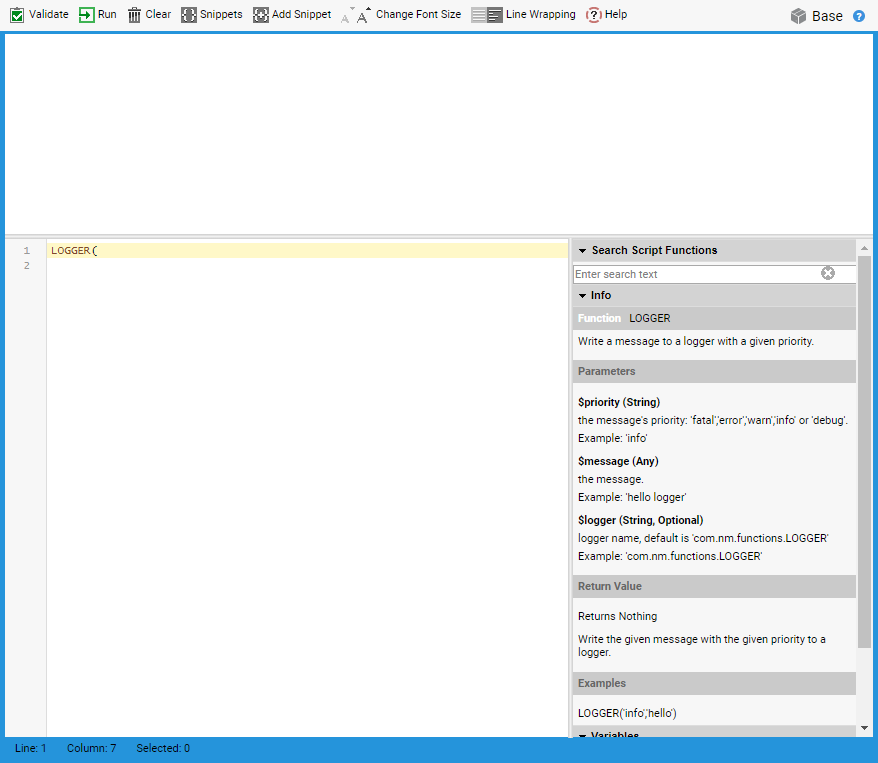
LOGGER() Function
The LOGGER() Function allows you to log messages while your Solution is running, thus helping you figure out exactly what is happening. Here's what a typical call to the LOGGER() function looks like:
LOGGER('debug', JOIN('The value of $i is ', $i), 'com.nm.mylogger.workflow.ExpenseProcess')
Here's what the individual arguments do:
debug– Specifies the priority of the log entry. Since we're usingLOGGER()to debug our application, it's typically a good idea to leave this on 'debug'. If, instead, you want to log an error, a warning, or a general piece of information, you can change this to 'error', 'warn' or 'info', respectively.JOIN('The value of $i is ',$i)– This is the actual value that will be printed to the log. You can use theJOINFunction to join strings and variable values.com.nm.mylogger.workflow.ExpenseProcess– This is the logger into which your message will be written. Using a custom logger makes it easier for you to find your log entries later on.
It's important to add some way to find out where the log entry is coming from. If you forget to remove your calls to LOGGER(), you might suddenly find confusing log entries from earlier debug sessions. If you left no clue to where the log entries are coming from, it can be quite hard to find out how to remove them.
Output created using the LOGGER() function can be found in the Appway Studio by going to System Maintenance > Logging > Log Viewer.
Note: Keep in mind that on Production systems, log-entries with a priority of 'debug' will typically not be shown. If you need to debug on a Production system, you need to use a priority other than 'debug'. The reason for this is that you do not want to see debug log entries an administrator forgot to remove appearing on a Production system.