Log Viewer
Introduction
To increase workload throughput and availability, the Platform is able to run on multiple nodes. However, system problems and errors can occur on any node at any time. To facilitate monitoring and debugging, the Platform introduced the Cluster Log service.
The purpose of the service is to collect and display all log messages that are produced on any of the nodes in the cluster. It alleviates the need to go through log files spread in every node to investigate an issue. Log messages collected within the last 30 minutes are kept in memory. This is useful if you need to investigate recent problems and to debug your solution.
If you plan to persist log messages to a storage system, or if you want to keep in memory log messages that are older than 30 minutes, please refer to Configuration Reference.
Usage
To browse log messages collected by the Cluster Log service, either call the service directly (as described in section APIs and Query or go to FNZ Studio Composition: System Maintenance > Logging > Log Viewer.
Note that the Log Viewer displays Cluster Log statements related to all the nodes for which there are logs saved in the distributed map (i.e. also Cluster Log Statements for nodes that have been shut down).
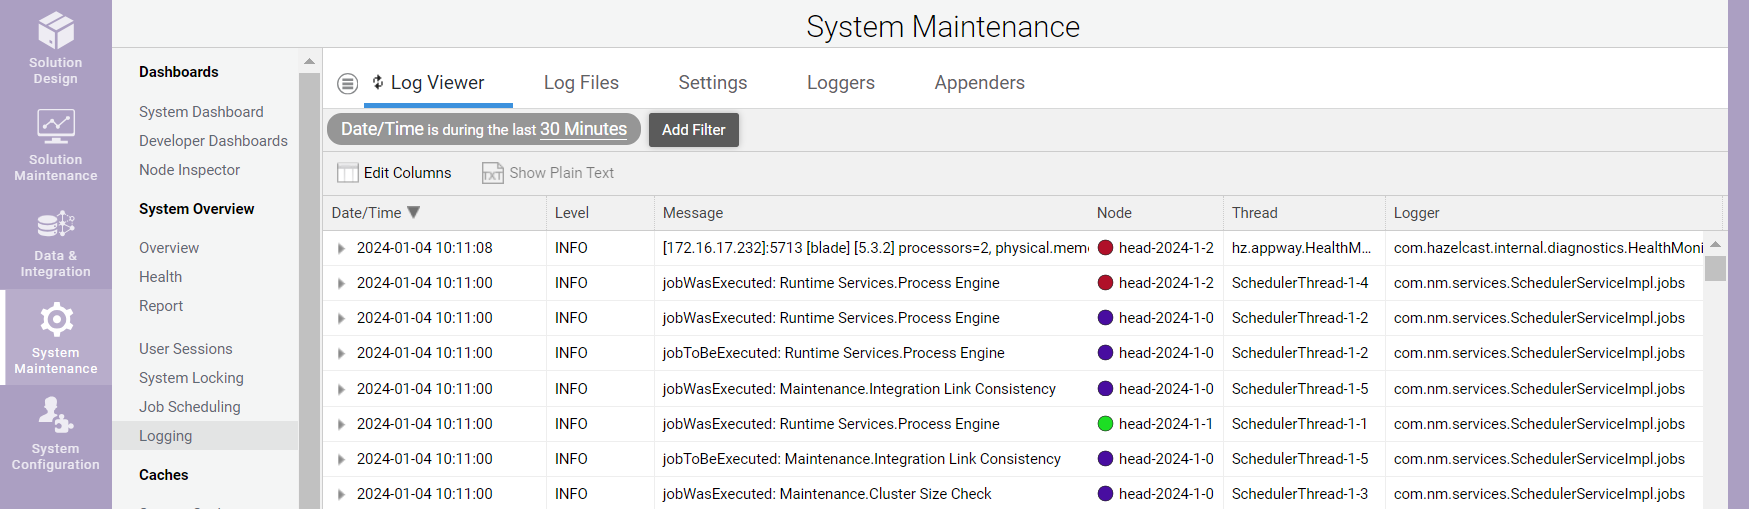
You can filter collected log messages according to:
- Time
- Log level
- Log message text
- Node name
- Thread name
- Logger name
Use Edit Columns to display additional columns. Specify a property name, e.g., "requestId", and a new column is shown displaying the property found in the Log4j mapped diagnostic context (MDC). You can filter and sort based on this new column.
Use Show Plain Text to display a plain text version of the selected log messages. This is helpful if you want download a list of interesting log messages.
Design and Implementation
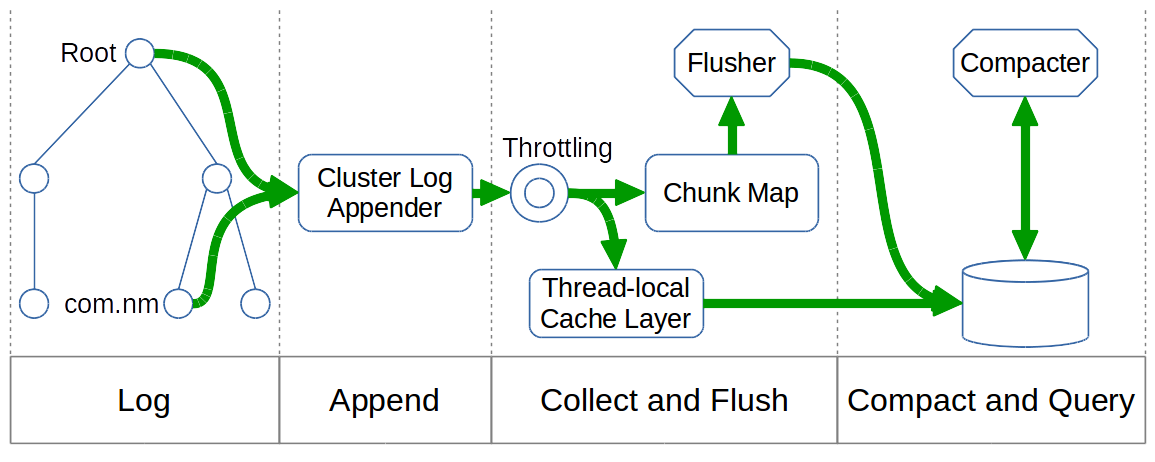
The figure below shows the overall architecture of the Cluster Log service, including its different phases:
- Log
- Append
- Collect and Flush
- Compact and Query
System Integration
To reuse the existing logging code and configuration, the Cluster Log service is plugged into the Log4j logging framework. A new Log4j appender called the Cluster Log appender is connected to the Log4j root logger and the Log4j logger for the main Package 'com.nm' .
Note: By default, the Platform uses no additivity for the 'com.nm' logger. Therefore, connecting the Cluster Log appender to the Log4j logger for the 'com.nm' package – in addition to connecting it to the Log4j root logger — is required.
Log messages are not only sent to the standard, file-based Log4j appenders (e.g., debug.log or error.log), but also to the Cluster Log appender. While the file-based Log4j appenders populate log files containing only the log messages produced on each individual node, the Cluster Log appender maintains a distributed data structure containing the log messages of all nodes. This distributed data structure can be used on any node to query and display log messages from all nodes.
Startup and Shutdown
The Cluster Log service is started shortly after the Cluster service is initialized (in phase 1 of the startup procedure). The service is stopped after all other services right before the Cluster service is stopped.
Startup Procedure
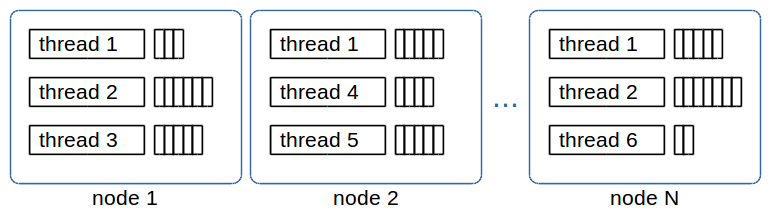
A Cluster Log statement is a container for the log message and related metadata. During startup, all statements are either dropped or compacted.
The temporary in-memory Cluster Log appender collects log statements during startup which are produced before the Cluster Log service is started. This appender keeps a list of Cluster Log statements for every thread on every node, as shown below:
Upon startup, the temporary in-memory Cluster Log appender is replaced by the "real" Cluster Log appender that maintains a distributed data structure. All collected Cluster Log statements are moved and stored in the distributed data structure. The flush and compaction threads are then started.
Shutdown Procedure
The Cluster Log appender is detached from the Log4j root logger and the Log4j logger for the 'com.nm' package. No new Cluster Log statements are collected.
The flush thread moves all remaining Cluster Log statement chunks to the distributed data structure and then stops.
The compaction thread simply stops. No final compaction is done because leftover Cluster Log statement chunks are checked upon startup anyway.
Log Message Collection
To log a message, Log4j creates a new logging event and sends it to all configured appenders. If the new logging event reaches the Cluster Log appender, the following process occurs:
The logging event’s level is checked against the Cluster Log threshold. It has to be equal or higher than the configured threshold to be processed; otherwise, the logging event is discarded. The Cluster Log threshold can be configured using the "nm.cluster.log.threshold" property. See Configuration Reference for details.
Afterwards, a new Cluster Log statement is created from the information contained in the Log4j logging event. Basic information (timestamp, logging level, logger name, message, stacktrace) as well as data from the mapped diagnostic context (MDC) are extracted. MDC is configured using the "nm.cluster.log.properties" property. See Chapter 4 for details.
The Cluster Log service then applies a throttling mechanism to the log statement. If the log statement passes this throttling test, the Cluster Log statement list for the current thread is fetched from the chunk map. The chunk map holds one or more log statement lists for every thread and time interval, as shown in Figure 4.
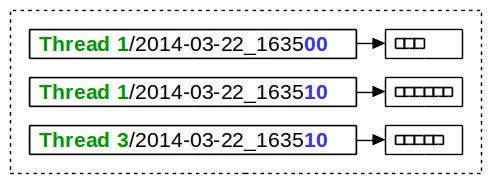
The chunk map is a regular, non-distributed ConcurrentHashMap. Its key is a String composed of the thread name, a slash character, and the formatted beginning of the time interval of the Cluster Log statement list. Its value is a LogStatementList which holds log statements produced within 10 seconds. An entry in the chunk map is called a chunk (of log statements). The new Cluster Log statement is added to the matching chunk. If no matching chunk exists, a new one is created and added to the map.
The process described in this section is lock-free and local-only, meaning, collecting a new log message in the Cluster Log service is fast and cheap. However, the log message is not yet stored in a distributed data structure; hence, it is also not yet available on all nodes. The process of moving completed chunks from the local area to the distributed data structure is called "flush" and is explained in section 3.6.
Thread-Local Isolation
While collecting log statements, the Cluster Log service determines if the thread uses commit logic or not. "Commit logic" here means that a thread persists all its modifications together during a commit. For example, all HTTP requests use commit logic.
If a thread does not use commit logic, the process works as explained in section Log Message Collection above.
If it uses commit logic, a new log statement is not added to the chunk map but is kept in chunks in a thread-local cache layer. These chunks are added to the distributed data structure upon Cluster commit, i.e., the same time changes in process data are committed and made visible to the cluster.
Use the commit logic to make sure that no trace of a running transaction, such as updating a process instance, is visible in the logs until it is committed. In this way, you can prevent data leakage out of a transaction.
However, commit logic for logging has the disadvantage that log messages for long running transactions only become apparent when the transaction finishes. For transactions that never finish, such as a thread in an endless loop, log messages would never become visible. Therefore, commit logic is disabled by default.
To enable commit logic, set the following property to true:
nm.cluster.log.usecommitlogic
Throttling
Depending on the number and size of log messages created, collecting all log statements from any node in the cluster may be prohibitive because of CPU, memory, and network consumption. Even though log messages are collected in a lock-free and local-only approach at first, they will eventually have to be processed and replicated to other nodes in the cluster.
To protect the system from very high resource usage, configurable limits on how much log data can be collected per node and time interval are available:
nm.cluster.log.limit.chunkvolume– limits the amount of log data per chunk interval (10 seconds). The default value is 400,000 characters per interval.nm.cluster.log.limit.compactionvolume– limits the amount of log data per compaction interval (10 minutes). The default value is 4,000,000 characters per interval.
As mentioned, these are limits imposed on each node separately. The total log volume per time interval is the configured limit times the number of nodes in the cluster.
Flush and Compaction
As explained in section Log Message Collection, new log statements are collected in the chunk map which is a regular, local-only ConcurrentHashMap.
To move log statements into the distributed data structure, the Cluster Log Flusher thread is used.
To reduce the possibly large number of chunks in the distributed map, the Cluster Log Compacter thread combines several chunks into a single compaction.
Flush
The Cluster Log Flusher thread runs every 10 seconds, always 3 seconds after the last chunk interval has finished. Hence, it runs at xx:xx:03, xx:xx:13, …, xx:xx:53. This ensures that no further log statements from that interval are expected.
Note: It is assumed that processing a new Log4j logging event takes less than 3 seconds, from the creation of the logging event until a new Cluster Log statement is been added to the chunk map.
As shown in the figure below, the Cluster Log Flusher thread loops through all chunks and moves them from the chunk map to the distributed map.
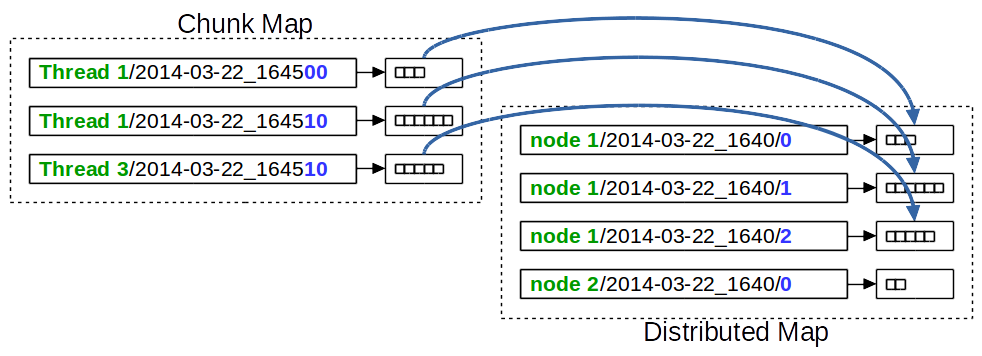
For moved chunks, the key in the distributed map is composed of the node name where the chunk was produced, the compaction interval, and a local counter. The local counter is generated and assigned to the chunk at the time when the chunk is created.
Compact
The Cluster Log Compacter thread runs every 10 minutes, always 3 minutes after the last compaction interval has finished. Hence, it runs at xx:03:00, xx:13:00, …, xx:53:00. This ensures that no further chunks from that time interval are expected.
Note that compaction is performed for all the nodes for which there are log entries in the distributed map, not only the active nodes.
Since compacting the collected chunks works on the distributed map, only one node performs this task.
Note: It is very unlikely that the time between creating the Log4j logging event until the log statement is created takes more than 3 minutes – even if a very long garbage collection would occur precisely at that moment.
The Cluster Log Compacter thread loops through all node names and looks for existing chunks in the current compaction interval. To find existing chunks, the local counter starts at 0 and is incremented until no further chunk exists. The log statements of all discovered chunks are combined into a single log statement list. Such a log statement list is called a compaction.
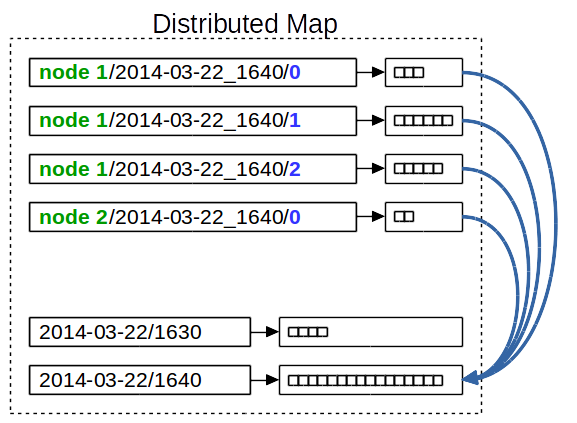
If an old compaction already exists for the current interval, then its log statements are combined with the new compaction. Compacted chunks are then deleted from the distributed map.
The key in the distributed map is the compaction interval. All compactions for one day have the same prefix. If using a file-based storage mechanism, they are stored in the same directory.
APIs and Query
To find log messages produced on any node of the cluster, one can simply ask the Cluster Log service by calling its API methods. Since the Cluster Log service runs queries directly on the distributed data structure, the matching log messages from all nodes are returned.
The Cluster Log service has the following API methods:
void append(LogStatement logStatement)List<LogStatement> list(long begin, long end)List<LogStatement> list(long begin, long end, LogStatementPredicate predicate)
The append() method adds a new Cluster Log statement to the Cluster Log. This method is used by the Cluster Log appender. Use the two List() APIs to find log messages in the Cluster Log.
The first List() method returns all log messages within the given time interval. Begin and end parameters are required to avoid having to loop through all existing data in the distributed data structure.
The second List() method accepts a LogStatementPredicate that allows log messages to be filtered by:
- Node names
- Thread name pattern
- Cluster Log statement properties
- Log levels
Configuration Reference
The following properties can be used to influence the behavior of the Cluster Log.
-
nm.cluster.log.threshold - Log events having a level below this threshold are not written to the Cluster Log. Possible values: ALL, TRACE, DEBUG, INFO, WARN, ERROR, FATAL, OFF. Default value: DEBUG. Requires system restart: Yes, unless change is made through Log4j API.
-
nm.cluster.log.properties - Properties to include in log (read from Log4j MDC). Possible values:
requestId,userId,httpSessionId,clientIP,locale,versionFilter. Default values:requestId,userId. Requires system restart: Yes. -
nm.cluster.log.clearonstartup- (Boolean) Whether to clear log statement lists map on startup or not. Note: This property has no effect if persistent is false. Possible values: true, false. Default value: true. Requires system restart: yes.
-
nm.cluster.log.usecommitlogic - (Boolean) Set to true to enable commit logic. Possible values: true, false. Default value: false. Requires system restart: no.
-
nm.cluster.log.limit.chunkvolume (Integer) Number of characters that may be collected per 10 seconds. Default value: 400000. Requires system restart: no.
-
nm.cluster.log.limit.compactionvolume - (Integer) Number of characters that may be collected per 10 minutes. Default value: 4000000. Requires system restart: no.
-
nm.cluster.log.eviction.ttl - (Integer) Time to live in seconds of a log statement list before it gets evicted. Note: Log statement chunks are never evicted since they are compacted after 13 minutes (at most). Possible values: 0 (unlimited), >= 900. Default value: 900. Dependency: If both maxidle and TTL are evaluated to 0, a TTL of 900 is used. Requires system restart: yes.
-
nm.cluster.log.eviction.maxidle- (Integer) Maximum idle seconds before a log statement list gets evicted (0 = never). Note: Log statement chunks are never evicted, since they are compacted after at most 13 minutes. Possible values: 0, >= 900. Default value: 0. Dependency: If both maxidle and TTL are evaluated to 0, a TTL of 900 is used. Requires system restart: yes
-
nm.cluster.log.persistent (Boolean) Whether to store log statement lists on permanent storage or not. Possible values: true, false. Default value: false. Requires system restart: Yes.
Note that this configuration property has been deprecated in FNZ Studio 2024 LTS.|