HTTP Tracing
FNZ Studio can collect HTTP request statistics with detailed information about what components used how much time during request processing. These statistics allow an FNZ Studio administrator to identify performance bottlenecks.
In detail, the collected information covers these two aspects:
- Request Tracing – Static information about an HTTP request: URL, user ID, client IP, parameters, headers etc.
- Call Tree Tracing – Information about processing times spent in individual engines and components of FNZ Studio: Screen processing, Expression Language, Script Functions, App Tasks and so on.
The following sections describe the configuration you can perform and how to access the results of HTTP tracing.
Configuring Request Tracing
HTTP Request Tracing is disabled by default. To enable request tracing, go to System Maintenance > Statistics > HTTP Tracing/Network Statistics and select Enable Tracing.
The following configuration properties define the exact behavior of request tracing:
nm.tracing.enabled– Iftrue, enables HTTP Tracing. Has the same effect as the Enable Tracing button. Default:falsenm.tracing.time.threshold– Defines the threshold for processing time below which requests are not traced, in nanoseconds. Default: 0nm.tracing.requestinfos.collect– Iftrue, enables tracing request information. Default:true
Note: We recommend that you do not set this property to `false`. To disable collecting request information, use the Disable Tracing button or set the `nm.tracing.enabled` property to `false` instead.
nm.tracing.requestinfos.maxnum– Defines the maximum number of requests to keep in memory and display in the Studio. Default: 100
Filter Pattern Settings
If request tracing is enabled, you can set up to four filters to determine which requests are traced. To do so, click on the menu icon and select Filter Pattern Settings:
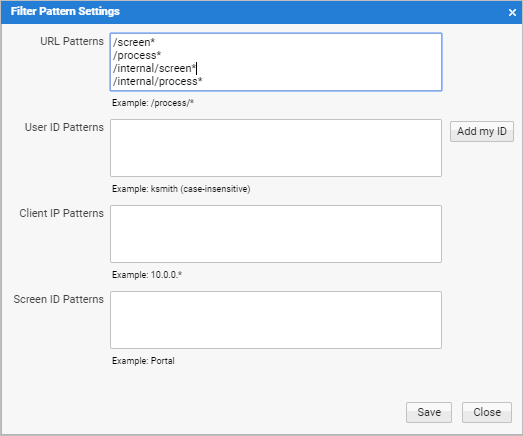
HTTP Tracing must be enabled explicitly. Once it is enabled, filters are used to determine what request have to be traced. There are four filters:
- URL Patterns – Limits tracing to URLs which match the given patterns. The filter is configured by entering one URL pattern per line. Use the wild card character "*" to specify URLs starting or ending with a certain string. Note that this filter checks only the URL part after the context path of the web application.
- User ID Patterns – Limits tracing to the specified list of user IDs. Every line corresponds to a user ID (or user ID pattern). The filter is case-insensitive. Use the special value "anonymous" to refer to anonymous (not authenticated) users.
- Client IP Patterns – Limits tracing to requests coming from certain client stations.
- Screen ID Patterns – Limits tracing to Screen IDs that match the specified patterns.
Notes:
- If no value is specified for a filter, it is disabled and has no impact on whether a request is traced or not.
- These settings are not retained when restarting the server. After restarting, HTTP Tracing is disabled again.
The following configuration properties define the pre-filled filter values:
nm.tracing.filterpatterns.url Default: /screen*,/internal/screen*,/process*,/internal/process*,/json-rmi*,/api*,/rest-api*nm.tracing.filterpatterns.useridnm.tracing.filterpatterns.clientipnm.tracing.filterpatterns.screenid
Configuring Call Tree Tracing
Call Tree Tracing is disabled by default. To enable this type of tracing, go to System Maintenance > System Statistics > HTTP Tracing/Network Statistics and select Enable Call Trees.
Note: Request Tracing must be enabled for Call Tree Tracing to work.
Limit the data generated by Call Tree Tracing using these two additional settings:
- Time Threshold – Call Tree nodes with a processing time smaller than this value do not get recorded. See the description of
nm.tracing.calltrees.threshold.timejust below. - Depth Threshold – The Call Tree is limited to a maximum depth. See the description of
nm.tracing.calltrees.threshold.depthjust below.
The following configuration properties define the exact behavior of Call Tree tracing:
nm.tracing.calltrees.collect– Iftrue, enables Call Trees. Has the same effect as the Enable Call Trees button. Default:falsenm.tracing.calltrees.maxnum– Defines the maximum number of Call Trees to keep in memory and display in the Studio. Default: 100nm.tracing.calltrees.threshold.time– Defines the threshold for processing time below which Call Trees are not traced, in nanoseconds. Default: 0nm.tracing.calltrees.threshold.depth– Defines the depth threshold up to which Call Tree nodes are created. Default: 1000nm.tracing.calltrees.trace.function.calls– Iftrue, enables tracing function calls. Default:truenm.tracing.calltrees.trace.servlet.filters– Iftrue, enables tracing servlet filters. Default:true
Reviewing the HTTP Tracing Statistics
Review the data collected by the HTTP Tracing module at System Maintenance > System Statistics > HTTP Tracing/Network Statistics.
The amount of data displayed in the Studio is limited to the 100 last requests / Call Trees by default. To prevent an entry from being removed after the threshold is exceeded, right-click on it and select Keep Request. You can adjust the threshold values using one the following configuration properties (the higher value takes precedence):
nm.tracing.requestinfos.maxnumnm.tracing.calltrees.maxnum
General information on the request is displayed in the table. Details can be accessed by right-clicking on an item and selecting Show Request Details or Show Call Tree.
Selecting Show Call Tree opens a new window with detailed information on the time spent on each process (clicking on a node hides/shows its child nodes):
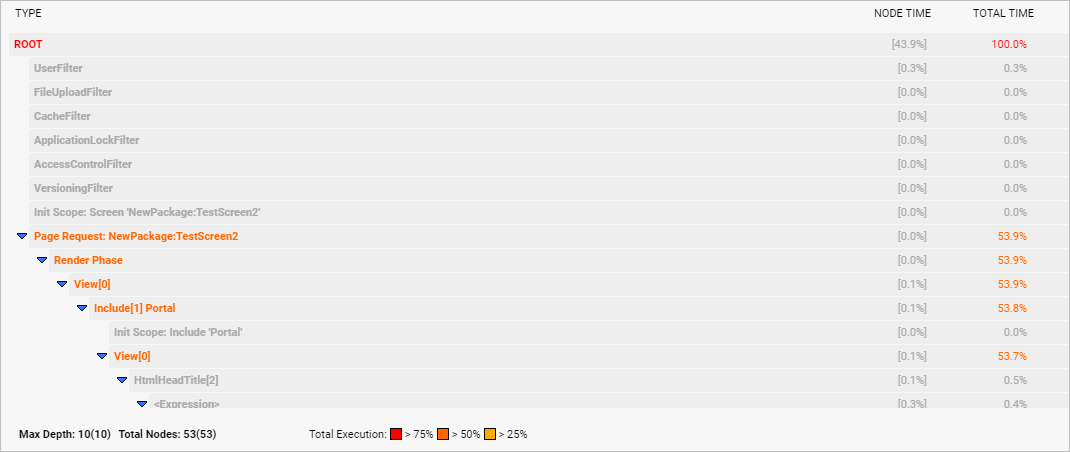
The times behind every node name represent the total execution time, including the time used to process child nodes. The times in brackets represent the inherent time spent in this node, not counting the time used to process child nodes. Color-coding is applied according to this logic:
- Red – Call Tree nodes with a total execution time of more than 75% of the overall request processing time.
- Dark orange – Call Tree nodes with a total execution time of more than 50% of the overall request processing time.
- Light orange – Call Tree nodes with a total execution time of more than 25% of the overall request processing time.
Script Functions
Two Script Functions are available for generating additional data for Call Tree tracing:
TracingEnterTracingExit
An example:
TracingEnter('MySpecialSection');
Try
// do something
Finally
TracingExit();
End
If the above script is executed, the Call Tree contains an additional node called MySpecialSection.