I/O Statistics
Introduction
The I/O Statistics feature in Studio keeps track of all read, write, and other operations (for example, delete operations or listing all existing keys) performed on disk. Specifically, it displays an overview of the operations performed since the statistics were last reset (or the system restarted).
Access: System Maintenance > Statistics > I/O Statistics.
Interpreting I/O Statistics
UI overview
The I/O Statistics table displays the following columns (from left to right):
- Type – Map, Lucene or any other I/O-related item.
- Context – Name of the I/O-related item.
- Count – Total number of operations measured for each I/O-related item (read, write or other).
- Last measurement – Date and time of the last operation.
- # Lock – Number of times a lock was acquired for an operation.
- Time (L) – Total time spent to acquire the specified lock (milliseconds).
- # Read – Number of read operations.
- Size (R) – Total volume of read data (MB).
- Time (R) – Total time spent for read operations (milliseconds).
- Throughput (R) – Size/time ratio for read operations (MB/second).
- # Write – Number of write operations.
- Size (W) – Total volume of written data (MB).
- Time (W) – Total time spent for write operations (milliseconds).
- Throughput (W) – Size/Time ratio for write operations (MB/second).
- # Other – Number of other operations.
- Time (O) – Total time spent for other operations (milliseconds).
I/O Statistics Example
The following table is an example of I/O Statistics:
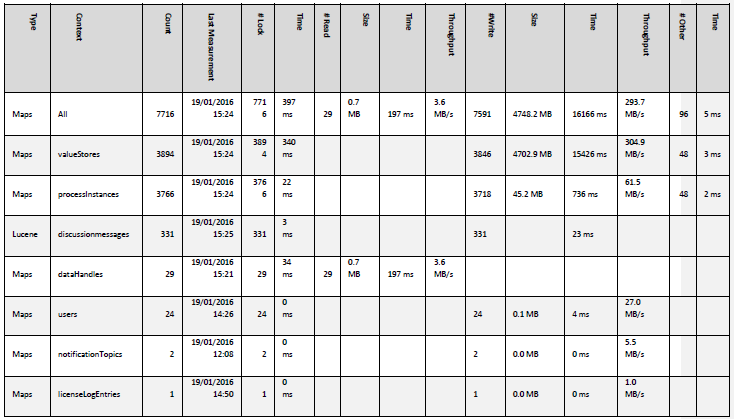
Following is some information that can help you interpret the statistics shown in the table:
- Context (map name) – The table shows that there are different items written on disk: they are mainly Value Stores and Process Instances, but also discussion messages, users, notification topics, and license log entries. Moreover, it shows that 29 data handles were read.
- # Write (number of write operations) – This figure (for example 3846) indicates the number of changes performed on Process data. The load test runs during 5 hours (5*60*60 = 18000 s) for 30 concurrent users. This means that 0.2 operations are performed per second (3846/18000= 0,2 op/s). This is a rather low number. In fact, since one user is estimated to perform one operation every 7,5 seconds, the expected result for 30 concurrent users would be 4 operations per second (30/7.5 = 4 op/s).
- Throughput (W) (write operation throughput) – This figure exclusively refers to the throughput achieved during write operations. For example, 304.9 MB/s is the throughput reached while writing Value Stores.