Memory Disk Utilization
FNZ Studio provides various tools to get data on CPU, RAM or disk space utilization.
Node Inspector
Go to System Maintenance > Dashboards > Node Inspector in Studio, and click the Node Inspector option. You can enrich the data shown by the Node Inspector by expanding the flap on the right of the window.
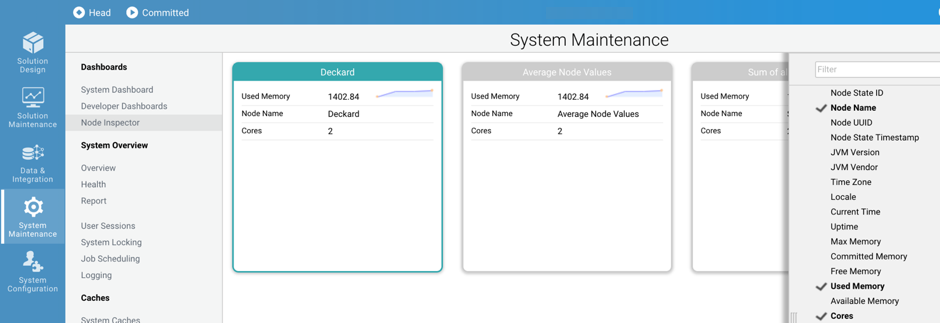
The Dashboard and the Node Inspector show data for each node in a multi-node installation.
System Overview
Another way is to go to System Maintenance > System Overview > Overview, where memory and disk space utilization data can also be found. Take the disk space utilization data displayed as a guideline, as the underlying type of disk may affect the accuracy of the results.
The Overview, like the System Dashboard and Node Inspector, displays the data for each node used in your installation.
Furthermore, there are two scheduled jobs, Low Memory Check, and Low Disk Space Check which run by default. They are found under System Maintenance > System Overview > Job Scheduling. If either of these two jobs encounters a problem, a system log message appears in Studio's discussion feed.
Health Sensors
A third way to check Memory and Disk Utilization is to check the Java Memory and Disk Space Health Sensors. Go to System Maintenance > System Overview > Health to inspect them. The sensors periodically check the status against a configured threshold, and generate an alert (a red error bar at the top of the Studio) if there is an issue.
For full information, see System Health.