System Health
Introduction
The System Health service is a built-in FNZ Studio service that constantly monitors critical aspects of an installation, where the system responsiveness, performance, stability, consistency, or integrity could be affected if the monitored component did not behave as expected.
A good example of such aspect is the amount of free space on the disk where the data home directory is located. Generally, services, engines, and components save information on this disk. If the disk runs out of free space, FNZ Studio may fail to store more data. If a power outage or a system crash occurs at the same time, everything kept only in memory is lost, which is why this aspect is considered critical for FNZ Studio.
Many enterprise customers already have dedicated monitoring solutions in place that are based on third-party products. These solutions are often operated by the IT department. From this point of view, the system health service is a second safety net, with the advantage that it is tightly integrated with FNZ Studio. It has access to FNZ Studio’s internal information that may be hard to monitor from the outside, and it can use Platform-specific channels to notify users about potential problems.
System Health Service
The system health service is an active service component built into the core of FNZ Studio. It starts at the same time as FNZ Studio web application and runs in the background for as long as FNZ Studio runs.
Sensors
The system health service internally manages a list of "Sensors". Every Sensor is responsible for monitoring a particular sub-component. There are Sensors for operating system related aspects, e.g. CPU Usage or Disk Space, for Java or JVM-related aspects, e.g. Java Memory or Java Threads, and Platform-specific Sensors, e.g. Cluster Storage or Process Locks. A complete list of all Sensors can be found in the System Health Sensors section of this article. Let's see some examples. Java Threads Sensors monitor long-running operations. This operation Sensor tells you if there is a heavy workload on the system, letting you preempt issues instead of needing purely to react to them. Other important Sensors are Process Jobs Sensors, which alert you about jobs not running properly. The Cluster Storage Sensor checks if FNZ Studio is able to read from and write to the cluster storage, which is the primary long-term persistent storage of FNZ Studio. The Map Persistence Sensor helps you avoid losing data as it verifies the status of each distributed map for which the persistence option is enabled. If entries added to distributed maps cannot be written to the cluster storage, the Sensor is triggered.
The system health service polls every Sensor in a Sensor-specific interval. Polling means that the Sensor is asked to report the current status of the sub-component it is monitoring. Some Sensors are polled once every minute, while other Sensors are polled only once every hour or even less.
Note: For some Sensors, polling intervals are hard-coded and cannot be changed, while for other Sensors the intervals are configurable. See System Health Sensors (Reference) for details on individual Sensors.
Sensor States
Every poll of a Sensor generates a "Sensor state", which represents the current status of the monitored sub-component, like a snapshot at that point in time. A Sensor state contains the following information:
- A Sensor state level: OK, WARN, ERROR, DOWN, or UNKNOWN
- A textual description of the Sensor state, e.g. "Free disk space is at 43% (65 GB)"
- The date and time at which the Sensor state has been generated
- The ID of the Sensor, e.g. "DiskSpace"
- The name of FNZ Studio node (important for cluster installations)
Sensor State Levels
Most Sensors have one or more thresholds at which the Sensor state level changes from OK to WARN and then from WARN to ERROR. In some cases, these thresholds are hard-coded, in other cases the thresholds can be configured. See System Health Sensors (Reference) for details on individual Sensors.
Example: The Disk Space Sensor changes from OK to WARN if the percentage of free disk space falls below 10% and to ERROR if it falls below 1%.
Details on Sensor state levels:
- OK – Indicates that the monitored sub-component is operating within an acceptable range. What is "acceptable" depends on the Sensor-specific thresholds.
- WARN – Indicates that the sub-component is still working, but may be close to a critical situation.
- ERROR – Indicates that the sub-component is in a critical state, and that it likely has a negative impact on overall system health.
- DOWN – Indicates that the system health service is not able to poll a Sensor. This is usually the result of a programming error in the Sensor and should not happen on a production system.
- UNKNOWN – An artificial state. It shows up only in the Health administration tool for Sensors for which no Sensor state is available. This can be the case immediately after start-up, e.g. if the health service has not had time to poll the Sensor or if the Sensor has been disabled (Configuration Properties (Reference)) and is not polled at all.
Sensor States in a Cluster Installation
If FNZ Studio is running in cluster mode, every Platform cluster node has its own system health service. Most Sensors only monitor aspects local to their node. The Disk Space Sensor, for example, only checks the amount of free space on the local disk.
The latest Sensor state of every Sensor is saved in memory in a distributed Hazelcast map, so every cluster node has access to all Sensor states of all other cluster nodes as well. This allows the 'Health' Administration Tool to generate a cluster-wide view with all Sensors and Sensor states on all cluster nodes.
Note: Sensor states are not persisted, and there is no Sensor state history. If FNZ Studio is stopped (all cluster nodes), the collected Sensor states are lost.
Retrieving Sensor States
The GetSensorStates function retrieves the current state of the requested Sensor(s). You can use this data in different ways, e.g. display it in an external system, perform further analysis, or create a custom report.
See: Exposing the Status of System Health Sensors.
GetSensorStates provides the following parameters:
query(optional) Iftrue, the Sensors are queried before returning the result. Type: BooleanSensorIds(optional) Comma-separated list of Sensors whose state you want to retrieve. If no value is specified, the states of all Sensors are retrieved. Type: String
Example: GetSensorStates(false, 'Extensions,CPUUsage')
The return type is a Data Class called SensorState (available in the Base Package). Do not modify this Data Class. An example of a return value:
SensorState[
    SensorState{@ref=SensorState/1541094960857, description=CPU usage average over the last minute is at 0%., level=OK, nodeName=Deckard, sensorId=CPUUsage, updateTime=1529414685500},
    SensorState{@ref=SensorState/1541094960863, description=All extensions are currently started., level=OK, nodeName=Deckard, sensorId=Extensions, updateTime=1529414663576}
]
Note: The `GetSensorState` function is only available if the Functions extension is installed.
Implementation Details
The system health service uses a single dedicated thread for Sensor polls. The thread name is SystemHealthService.SensorStatePoller. It polls Sensors in sequential order. The thread does its best to guarantee the Sensor-specific polling intervals, but if a Sensor is "misbehaving" and does not return a Sensor state within a reasonable amount of time, the thread is blocked and may fail to poll other Sensors in the desired interval.
Example: The Data Sources Sensor checks the availability of every data source configured in FNZ Studio. It tries to connect to the database and executes a simple statement to see if the database is responding. If the database is down and the data source is not configured with a reasonable connection timeout, it can take several minutes until a Sensor state is returned. During this time, no other Sensors are polled.
'Health' Administration Tool
The Health administration tool can be found under System Maintenance > System Overview > Health:
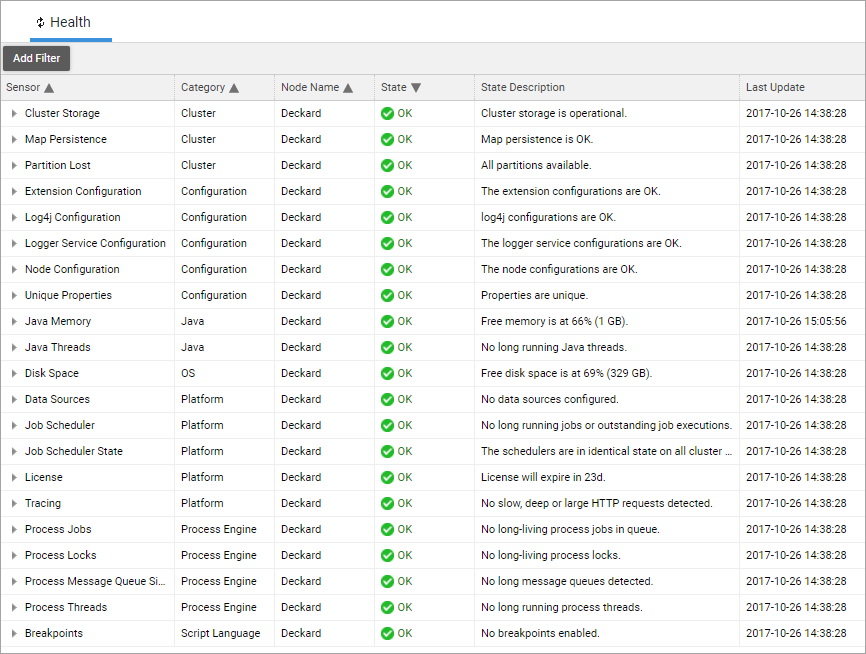
The table shows a list of all Sensors and the last recorded Sensor state. The following information is available:
- Sensor – Sensor name.
- Category – Sensor category (no functional impact).
- Node Name – Name of FNZ Studio node where the Sensor is located. Useful for cluster installations with multiple nodes.
- State – Sensor state level (e.g. OK, WARN, or ERROR).
- State Description – A textual description of the Sensor state, generated by the Sensor.
- Last Update – Date and time when the Sensor state level or state description last changed. If the Sensor is polled and the new state has the same level and description as the previously recorded state, the date in this column does not change. An exception to this rule is when the Sensor poll is triggered manually by a user (see the context menu actions described below).
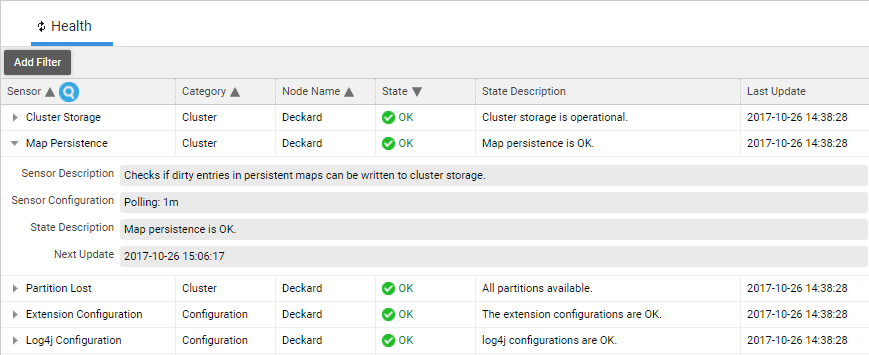
You can filter and sort on every column. By clicking on the small triangle icon in front of the Sensor name, you can get more information about the Sensor and its configuration:
Most Sensors have a context menu. Not all of them have the same set of actions, but a maximum of three actions is available:
- Query Sensor – Retrieves the current Sensor state. This action bypasses the usual interval-based poll mechanism and immediately polls the Sensor, synchronous in the HTTP request thread. This action updates the date in the Last Update column even if the Sensor state level and description do not change, confirming that the Sensor has been polled.
- Open [Tool] – A shortcut to jump to another administration tool. The Data Sources Sensor, for example, has a context menu action called Open Data Sources to switch to the Data Sources administration section. This is useful when you need more information about the cause of a warning or an error.
- Reset Sensor – Some Sensors keep internal historical or statistical information to analyze trends or to change their state only after several consecutive events. The Java Memory Sensor, for example, listens for out-of-memory errors and keeps a history of records to decide if and how many out-of-memory errors have occurred during the past 24 hours. This context menu action is used to reset the Sensor and discard this information.
System Health Notifications in FNZ Studio Composition
'System Health' Dashboard Widget
The Developer Dashboards available in System Maintenance have a System Info widget showing the current Sensor states in a simplified view:
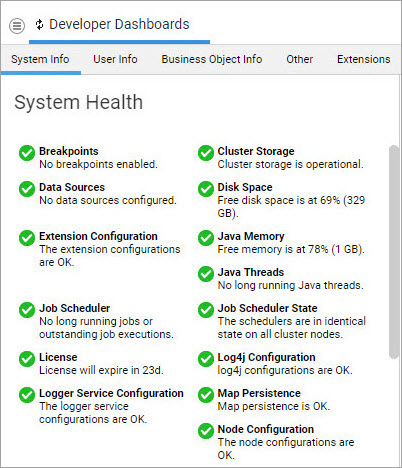
For cluster installations, the dashboard widget only shows the most critical state per Sensor. If the Disk Space Sensor is in WARN state on one node and in ERROR state on the second node, the widget will show the state of the second node.
System Health Studio Alert Bar
If a Sensor has detected a critical issue, an alert bar is displayed in FNZ Studio Composition for all users:
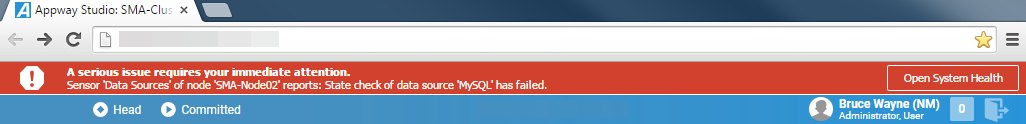
Only Sensors with the ERROR Sensor state level trigger this alert bar. Click on the Open System Health button to access the System Health administration tool.
FNZ Studio window polls the server once every minute to check if there are any critical system health issues. If a Sensor monitoring a failing resource has a poll interval of 5 minutes, it may take up to 6 minutes until the alert bar becomes visible and notifies users about the problem. and again up to 6 minutes until the alert bar disappears after the problem has been solved. Furthermore, the Studio window poll interval of 1 minute may lead to situations where some users already see the alert bar but other users do not. In case of uncertainty, system administrators should always consult the System Health administration tool.
Configuration Properties (Reference)
The following configuration properties are used to influence the system health service:
nm.system.health.service.enabled(Boolean) – Enable or disable the system health service. Changing this configuration property has an immediate effect and does not require a restart of FNZ Studio. Setting it tofalsestops the system health service. Sensors are no longer polled. Setting it totruerestarts the system health service. Default value:truenm.system.health.Sensors.disabled(String) – A comma-separated list of Sensor IDs defining Sensors that are disabled. Changing this configuration property requires a restart of FNZ Studio or at least a restart of the system health service (see above). Default value: empty Example value: CPUUsage,JavaMemory,ClusterSize
System Health Sensors (Reference)
Note: Some Sensors documented below might not be present on your Platform installation, as their availability depends on configuration settings or the presence of a certain extension. Dependencies of this type are indicated in the individual Sensor's description.nSensors contained in the SystemHealthSensors Extensions are not indicated this was, as this is a mandatory extension in FNZ Studio.
System Health Sensors are grouped into categories, and these are described in the sections below.
Category 'AppTasks'
Relationship Definition Update Function Execution Time
The Relationship Definition Update Function Execution Time checks the average execution time of Update Functions inRelationship Definition ABC / App Task. The Sensor is OK if the average execution times of Update Functions do not exceed the acceptable warning and error thresholds (500ms and 2s).
| System Installation Sensor Overview | |
|---|---|
| Polling Interval | 1 hour |
| Thresholds | WARN > 500ms; ERROR > 2s |
Category 'Cluster'
Cluster Size Sensor
The Cluster Size Sensor is available only if a minimum cluster size has been configured (see the System Installation guide for your FNZ Studio version). The minimum cluster size defines how many Platform nodes are required to guarantee the functionality of the cluster. The Sensor state level changes to ERROR if the number of active cluster nodes falls below the minimum cluster size, e.g. because a node has crashed or has otherwise been removed from the cluster.
| Overview | Value |
|---|---|
| Polling Interval | 1 minute |
| Thresholds | ERROR: current cluster size < min cluster size |
Cluster Storage Sensor
The Cluster Storage Sensor is one of the most important Sensors. It checks if FNZ Studio is able to read from and write to the cluster storage, which is the primary long-term persistent storage of FNZ Studio. It is the place where FNZ Studio stores data shared among all cluster nodes, from Process Instances to user accounts and Business Objects. FNZ Studio supports different cluster storage implementations, e.g. based on a network file system or a relational database. This Sensor is implementation-independent. It does not monitor the network file system or relational database, but it checks on a higher level if there have been any errors while reading or writing data from/to the cluster storage.
The Sensor checks how many read and write operations have failed during a certain period of time. The Sensor changes to the WARN level if there has been at least one failed operation within this period and to the ERROR level if more than 5% of the operations have failed.
Note: The Cluster Storage Sensor can take some time to recover from an ERROR state even if the persistence issue has been fixed. This is caused by the delay in the retry mechanism (CassandraHazelcastStore has a timeout of up to ten minutes).
The Sensor also tracks the number of "dirty" objects in memory. If an object such as a Process Instance is modified on one cluster node, it is first stored in the shared cluster memory state (a distributed Hazelcast map). This object is called "dirty" because it has not yet been saved in the cluster storage. Hazelcast takes care of persisting dirty objects to the cluster storage in the background. By default, dirty objects are persisted approximately 10 seconds after they have been saved in the shared cluster memory state. This is called a "write-behind" strategy. The total number of dirty objects is sometimes also referred to as the "size of the write-behind queue".
If the cluster storage system is not available, e.g. no write permission is granted, the database is not online, or FNZ Studio is not able to persist modified objects, FNZ Studio will try to persist dirty objects over and over again until it succeeds, but during this time, the number of dirty objects can continue to grow. The Sensor level changes to WARN if there are more than 5,000 dirty objects, and to ERROR if there are more than 20,000 dirty objects in memory.
System administrators must immediately react to errors reported by this Sensor. The longer it takes to recover from a cluster storage outage, the more data is saved only in memory and is at risk of being lost in case of a fatal cluster-wide crash.
| Overview | Value |
|---|---|
| Polling Interval | 1 minute |
| Messages | "Cluster storage is operational."; "2 of 134 read operations have failed in the last 2m 13s."; "93 of 112 write operations have failed in the last 1h 38m."; "Size of write-behind queue is over 12,931 entries since more than 4m 21s." |
Map Sizes Sensor
The Map Sizes Sensor monitors the local memory consumption of cluster maps and warns when any map exceeds the configured size threshold.
The sensor runs every ten minutes and changes from OK to WARN state if the local consumed memory size of one or more maps exceeds the warning threshold. The default warning threshold is 300 MB and can be overridden using the property: SystemHealthSensors.MapSize.warningSizeBytes = 314572800.
The sensor provides the map names that have exceeded the threshold, including their current size in MB.
| Overview | Value |
|---|---|
| Polling Interval | 10 minutes |
| Messages | "All maps are within safe size limits." |
Map Persistence Sensor
The Map Persistence Sensor verifies the status of each distributed map for which the persistence option is enabled. If entries added to distributed maps cannot be written to the cluster storage, the Sensor is triggered.
The Map Persistence Sensor checks two aspects of distributed maps:
- The number of entries which were not written to the storage, so-called "dirty entries". Every time the Sensor is polled, it saves the current number of dirty entries for every persisted map.
- If the number of dirty entries did not decrease in the last hour, the WARN level is triggered.
- If the number of dirty entries did not decrease in the last two hours, the ERROR level is triggered.
- The time interval between the last time an entry was added to the distributed map and the last time an entry was written to the cluster storage. This check is not performed for maps which have eviction enabled.
- If the time interval exceeds one hour and at least one dirty entry is detected, the WARN level is triggered.
- If the time interval exceeds two hours and at least one dirty entry is detected, the ERROR level is triggered.
Note: Under conditions of high load, this Sensor can be falsely triggered. In this case, wait a couple of minutes and the status should change back to "OK". If the warnings or errors persist, investigate the issue.
| Overview | Value |
|---|---|
| Polling Interval | 1 minute |
| Messages | "Map persistence is OK."; "There are 37 entries for businessObjectsMap not written to the storage since more than 2h 30m."; "Map businessObjectsMap was not persisted to the storage for 2h 27m." |
Partition Lost Sensor
The Partition Lost Sensor checks to make sure that all Hazelcast partitions are available to ensure data can be saved and accessed correctly. Hazelcast distributes data into partitions to optimize performance and creates backups of these partitions on other nodes of the cluster to ensure redundancy.
| Overview | Value |
|---|---|
| Polling Interval | 1 minute |
| Messages | "All partitions available."; "Partitions lost! Restart the Cluster." |
Integration Link Consistency Sensor
The Integration Link Consistency Sensor is triggered when it registers an inconsistency of Integration Link states across cluster nodes, e.g. when an Integration Link fails on one node of the cluster. This means that you do not need to connect to each node individually to keep track of the correct functionality of all Integration Links.
The check functions in the following way: All nodes report the states of their Integration Links to the Hazelcast distributed map. Each node then verifies that the states in the map are consistent.
The check is performed every 60 seconds, with an additional delay of 60 seconds at startup to avoid false positives (showing error messages caused by intermediate states).
| Overview | Value |
|---|---|
| Polling Interval | 1 minute |
| Messages | "All IntegrationLinks have consistent states over the cluster nodes."; "At least one IntegrationLink(INTEGRATION_LINK_NAME) is in inconsistent state. Inactive on this node and Started on node2." |
Hazelcast Errors Sensor
The Hazelcast Errors Sensor warns you about errors logged by Hazelcast. In detail, the Sensor checks if any Hazelcast WARN, ERROR, or FATAL messages were logged in the last minute. The Sensor state changes to WARN if there are any WARN log messages recorded in the last minute. The Sensor state changes to ERROR if there are more than 10 WARN messages or any other ERROR/FATAL log messages logged in the last minute
| Overview | Value |
|---|---|
| Polling Interval | 1 minute |
| Thresholds | WARN: >0; ERROR: >10 |
| Messages | "No errors or warnings found in the last 60 seconds"; "2018-06-26T15:02:49+0200 ERROR [10.0.10.185]:5713 [blade] [3.8.7] No join method is enabled! Starting standalone. nCheck the Logging page for all the log messages.” |
Entry Storage Sensor
The Entry Storage Sensor verifies that the entry storage is functioning correctly by writing an entry into the storage, reading it, and subsequently deleting it. This direct approach allows the Sensor to provide an immediate reaction when an issue occurs. Polling Interval is 1 minute:
| Error code | Message |
|---|---|
| OK | Entry storage persistence functions correctly. |
| ERROR | Entry storage persistence check failed. |
| UNKNOWN | Unable to check persistence as the Map Store used does not have an entry storage engine. |
Moreover, the Entry Storage Sensor computes the duration of the operations and issues errors if the time exceeds the predefined thresholds. The thresholds for the duration of the operations can be configured using the following properties (default values are set to 30000 milliseconds):
SystemHealthSensors.EntryStorage.storeTimeoutMsSystemHealthSensors.EntryStorage.loadTimeoutMsSystemHealthSensors.EntryStorage.deleteTimeoutMs
Cluster Node Sensor
The Cluster Node Sensor is a Health Sensor that reports the status of the local cluster node. For more information on the cluster node status, see Cluster Status and Cluster Supervisor Services.
| Error code | Message |
|---|---|
| OK | The status of the local cluster node is RUNNING. |
| ERROR | The status of the local cluster node is other than RUNNING. |
Category 'Configuration'
Cluster Configuration Consistency Checks
Three health Sensors are available which detect cluster configuration problems.
All these Sensors spawn a distributed task that is in charge of collecting local information. This information is later merged before the Sensor state is updated.
Unique Properties Sensor
The Unique Properties Sensor checks the configuration and ensures that the properties nm.uid.prefix, nm.cluster.local.nodename, and all properties mentioned in the property nm.cluster.additional.unique.properties have a different value on every node of the cluster.
In case of a clash, details regarding which nodes are clashing on which property are displayed. Also, in order to make it easier to pinpoint where the problem has occurred, the Sensor reports an ERROR only on the nodes whose configuration collides.
| Overview | Value |
|---|---|
| Polling Interval | 5 minutes |
| Thresholds | WARN: > 0 consecutive errors; ERROR: > 2 consecutive errors |
| Messages | "Properties are unique."; "Clash on property nm.uid.prefix=Node1 for node 172.16.0.32:5713." |
Node Configuration Sensor
The Node Configuration Sensor checks that all nodes are configured in the same manner. This includes the following checks:
- The same Java Virtual Machine is employed. For example, this check fails if one node runs on Java 1.6 and another one on Java 1.7, while it succeeds if the two nodes employ Java 1.7.0_67 and 1.7.0_79, respectively.
- The information extracted from the manifest file are the same. This includes, among others, the build date and version.
- The same Platform version and backup format version are used.
- All the configuration properties apart from the unique properties (see Unique Properties Sensor), the properties listed in
nm.cluster.additional.nosync.propertiesand the data home path are the same.
In case of configuration problems, the configuration properties which are not identical are displayed, together with the respective configuration values.
| Overview | Value |
|---|---|
| Polling Interval | 10 minutes |
| Thresholds | WARN: >0, ERROR: >2 |
| Messages | "The node configurations are OK."; "appway.version = [7.0-dev, 8.0-dev]" (if you have 2 nodes with 2 different Platform versions) |
Extension Configuration Sensor
The Extension Configuration Sensor checks that the same extensions and plugins are installed and configured identically on each node of the cluster.
For all extensions (including those not running), the MD5 checksum is computed on the JAR files.
Also, the default configuration of the extension is extracted from the archive, values potentially set in the extension's CFG file are applied, and the resulting configuration is checked across all nodes.
If an extension is installed on a subset of the nodes in the cluster, the ERROR message will be in the format <extension name> not installed on all nodes (<adapter not running|running adapter>).
If the problem is due to a misconfiguration, all non-unique properties (and respective values) are printed.
| Extension Configuration Sensor Overview | Value |
|---|---|
| Polling Interval | 10 minutes |
| Thresholds | WARN: >0; ERROR: >2 |
| Messages | "The extension configurations are OK."; "Functions extension not installed on all nodes (extension not running)."; "Functions extension not running on all nodes." |
Logging Configuration Consistency Checks
Two health Sensors are available for detecting conflicting logging settings.
Both Sensors spawn a distributed task in charge of collecting local information, which is then merged before updating the Sensor state.
Log4j Configuration Sensor
The Log4j Configuration Sensor monitors the following log4j configuration files and merges the settings if needed:
$DATA_HOME/conf/log4j.propertiesclassloader://com/nm/conf/log4j.properties$DATA_HOME/conf/log4j-additional.properties
If any inconsistency is detected, the WARN/ERROR message includes each conflicting property with the differing values, e.g.: "log4j.additivity.com.nm = [true, false]"
| Overview | Value |
|---|---|
| Polling Interval | 10 minutes |
| Thresholds | ERROR: >0 |
| Messages | "log4j configurations are OK."; "log4j.additivity.com.nm = [true, false]" |
Logger Service Configuration Sensor
The Logger Service Configuration Sensor monitors that the configuration of the LoggerService is uniform across the cluster. This logger is aimed at detecting changes which can be applied at runtime; it ignores the configuration files.
| Overview | Value |
|---|---|
| Polling Interval | 10 minutes |
| Thresholds | WARN: >0 |
| Messages | "The logger service configurations are OK."; "logger [com.nm.utils.AppwayHeaderUtils] has [2] different configurations:nName [com.nm.utils.AppwayHeaderUtils], additivity [true] on node(s) [node1]nName [com.nm.utils.AppwayHeaderUtils], additivity [false] on node(s) [node2]" |
Access Licenses Sensor
The Access Licenses Sensor checks if there are enough Access Licenses available to be assigned. The assigned Access License percentage is calculated per Module and per Lifetime type, Digital Logins, or Named Users.
To do so, the Sensor checks the Access License Packages (available in the Studio at System Configuration > Licenses > License File). The Sensor runs every hour and triggers a warning if more than 80% of the licenses are taken, and an error if more than 90% of the licenses are taken. When the Sensor reaches a WARN or ERROR state level, a message is issued containing details on the module/s that are running out of Access Licenses.
In the configuration of the System Health Sensors extension, you can do the following:
- Configure the thresholds (in percent) for WARN and ERROR states in the configuration of the System Health Sensors extension using the properties:
SystemHealthSensors.AccessLicenses.warnLimitDefault: 80SystemHealthSensors.AccessLicenses.errorLimitDefault: 90
- Disable or enable the check for the assigned licenses per Named User using the property:
SystemHealthSensors.AccessLicenses.namedUsers.enabledDefault:true
| Overview | Value |
|---|---|
| Polling Interval | 1 hour |
| Thresholds | WARN: >80%; ERROR: >90% |
| Messages | "There are enough Access Licenses available."; "Less than 20% (19000/100000) Access Licenses available in module [module name]." |
License Sensor
Every Platform installation has a license file that will expire at some future date. The License Sensor checks if the license file is valid and whether it will expire in the next 14 days (WARN) or in the next 24 hours (ERROR). These thresholds can be configured.
| Overview | Value |
|---|---|
| Polling Interval | 1 hour |
| Thresholds | WARN: license expires in < x days (based on the warnLimit configuration property, default value is 14 days); ERROR: license expires in < x day (based on the errorLimit configuration property, default value is 1 day) |
| Messages | "LicenseID <id> - License will expire in 172d.; "LicenseID <id> - License expired 5d ago." |
Certificates Sensor
The Certificates Sensor checks if there are any stored certificates that expire soon.
| Certificates Sensor Overview | Value |
|---|---|
| Polling Interval | 8 hours |
| Thresholds | WARN: there are certificates that expire in less than 2 weeks n ERROR: there are certificates that expire in less than 1 week |
Extension Configuration Sensor
The Extension Configuration Sensor checks if the extension configuration is valid and unique across all nodes of a cluster. Configuration properties are set in System Configuration > Extensions (seeManaging Extensions).
| Overview | Value |
|---|---|
| Polling Interval | 10 min |
| Thresholds | WARN/ERROR |
Category 'Data'
Data Store Extension Sensor
Checks if the metadata of the Data Classes is consistent with the Data Store requirements. An ERROR message is shown in case the metadata of the mapped Data Classes has accidentally been corrupted.
Note: This Sensor is only available if the DataStore extension is installed.
| Overview | Value |
|---|---|
| Polling Interval | 1 hour |
| Messages | "Data Class mapping is OK.; "The following DataClasses are mapped into the DB but have no table name in metadata 'DataStore_tableName' or the metadata is missing: Person; "Some DataClasses are mapped into the DB with the same table name stored in metadata 'DataStore_tableName': …" |
Business Data Storage Data Source Configuration Sensor
The Business Data Storage Data Source Configuration Sensor identifies and reports issues in the Data Source configuration for the BDS. This Sensor is only available if the Business Data Storage (BDS) extension is installed.
Business Data Storage Sync Status Sensor
The Business Data Storage Sync Status Sensor identifies and reports out-of-sync situations where the Database model is not aligned with FNZ Studio Data Model.This Sensor is only available if the Business Data Storage (BDS) extension is installed.
Business Data Storage Metadata Conflicts Sensor
The Business Data Storage Metadata Conflicts Sensor identifies and reports conflicts in the metadata of stored Data Classes, for example when more than one Data Class corresponds to the same main table. This Sensor is only available if the Business Data Storage (BDS) extension is installed.
Data History Display Value Function Execution Time
The Data History Display Value Function Execution Time Sensor monitors that the average execution time of the display value functions used by the Data History extension does not exceed the defined warning and error thresholds (0.3s/0.5s). This Sensor is only available if the Data History is installed.
Category 'Data Logic'
Data Logic Update Function Execution Time
This Sensor checks the average execution time of Update Functions in Data Logic Business Object The Sensor is OK if the average execution times of Update Functions do not exceed the acceptable warning and error thresholds (500ms and 2s).
| Overview | Value |
|---|---|
| Polling Interval | 1 hour |
| Thresholds | WARN > 500ms; ERROR > 2s |
Category 'Java'
Sensors related to Java and JVM aspects have one limitation that system administrators must know:
If a single Java application server is hosting multiple Java web applications, all web applications are executed in the same JVM process and share some resources, such as memory or CPU time assigned to this process. If a Sensor is raising an alarm, it is not necessarily a problem caused by FNZ Studio web application, but it usually has a negative impact on FNZ Studio as well.
Java Memory Sensor
The Java Memory Sensor monitors two memory-related aspects:
- The percentage of free JVM heap memory.
- If there have been any out-of-memory (OOM) errors in the past hours.
The percentage of free memory is calculated based on the currently used heap memory and the maximum heap memory the JVM would be allowed to use (usually a JVM configuration setting). There is no threshold for a WARN state level because it is very common that a JVM is using most of its available memory before a garbage collection is started. Such a threshold would generate too many false alarms.
You can configure the ERROR threshold as well as the polling interval for calculating the available free memory in the configuration of the System Health Sensors extension using the following properties:
SystemHealthSensors.JavaMemory.pollingIntervalDefault: 60 (in seconds)SystemHealthSensors.JavaMemory.errorLimitDefault: 1 (in percent)
Note: The SystemHealthSensors.JavaMemory.warnLimit property is currently ignored by this Sensor.
The Sensor also tracks the number of out-of-memory (OOM) errors generated by the JVM and detected by FNZ Studio. The Sensor state level changes to WARN if at least one OOM error has occurred in the past 24 hours and to ERROR if at least one such error has occurred in the past 60 minutes. In some cases, FNZ Studio is not able to detect OOM errors, as they can also occur in the code of the Java application server – third-party libraries can be used to catch such errors.
| Overview | Value |
|---|---|
| Polling Interval | 1 minute |
| Thresholds | ERROR: free memory < 1% |
| Messages | "Free memory is at 21% (253 MB); "3 out-of-memory errors have been detected in the last 24 hours" |
Java Threads Sensor
The Java Threads Sensor monitors two aspects of Java threads:
- How long Java threads have been executing a particular piece of work, e.g. HTTP request, job, distributed task.
- If two or more threads have run into a deadlock.
FNZ Studio tracks the "active time" of every thread while it is performing work in FNZ Studio. This includes:
- Processing of HTTP requests through web container threads.
- Execution of jobs through job scheduler threads.
- Execution of process jobs through process engine background threads.
- Execution of distributed tasks through Hazelcast threads.
This Sensor checks for long-running threads. It changes to the WARN level if a thread is active for more than 5 minutes, and to the ERROR level if it is active for more than 1 hour. To query for information about a long running thread you can go to:
- Solution Maintenance > Processes > Script Language > Contexts If it is a long running Appway script, it will be listed here and you can see from where it originates. See Contexts for details.
- Solution Maintenance > Processes > Java Threads Displays a list of all Java threads. Search the long-running thread and retrieve a stack trace by right-clicking the thread and selecting View Stack Trace. This helps you locate the problem. It is not advised to kill the thread since this can cause unexpected behavior.
The Sensor also checks if two or more threads are blocked by a deadlock, which occurs when two or more threads have acquired exclusive locks and are now all waiting to acquire another exclusive lock already held by another thread in this group. This is usually a permanent problem, and there is no way to solve this issue but to restart the Java application server.
Deadlock detection is not implemented by FNZ Studio itself but is based on an API call to the JVM. It only covers deadlocks implied by Java locks, e.g. through usage of synchronized methods or blocks. Deadlocks based on application-specific lock implementations or due to locks in remote systems causing a thread to be blocked waiting for a response cannot be detected by this Sensor. It is, however, very likely that the Sensor would raise an alarm because these threads will be categorized as "long-running".
| Overview | Value |
|---|---|
| Polling Interval | 5 minutes |
| Thresholds | WARN: active time > 5 minutes; ERROR: active time > 1 hour |
| Messages | "No long-running Java threads.; "Java thread 138 has been active for 1h 28m.; "Java threads 12,89,182 are blocked by a deadlock." |
Category 'Maintenance'
Data Audit Trail Catalog Settings Sensor
Checks if the metadata of Data Classes is consistent with the existing Catalog IDs.
Note: This Sensor is only available if the Data Audit Trail extension is installed. For more information, see DataAuditTrail Extension .
| Overview | Value |
|---|---|
| Polling Interval | 1 hour |
| Messages | "Data Class mapping to Catalog ids is OK."; "The following Data Class(es) have one or more properties with a reference to an outdated Catalog id (not found or marked as deleted):- Data Class 'TestDataClass' problematic property name to catalog id: (sector - PartyPhysicalProfessions). To fix the issue change the catalog assigned to the property in the Data Audit Trail configuration UI (Data Class Configuration page)." |
Category 'Network'
The 'Network' category includes three Sensors that detect network issues:
- Network Ping
- Hazelcast TCP
- Hazelcast Task
Under normal conditions, the status of each Sensor is updated every ten seconds, however Sensors with the ERROR status level are queried only once every 40 seconds to avoid putting further stress on a system with possible problems.
Events are logged in two locations:
- At the default application server location (e.g., in
$CATALINA_HOME/logs/catalina.outif Apache Tomcat is used) - In
$DATA_HOME/logs/connectivity.log
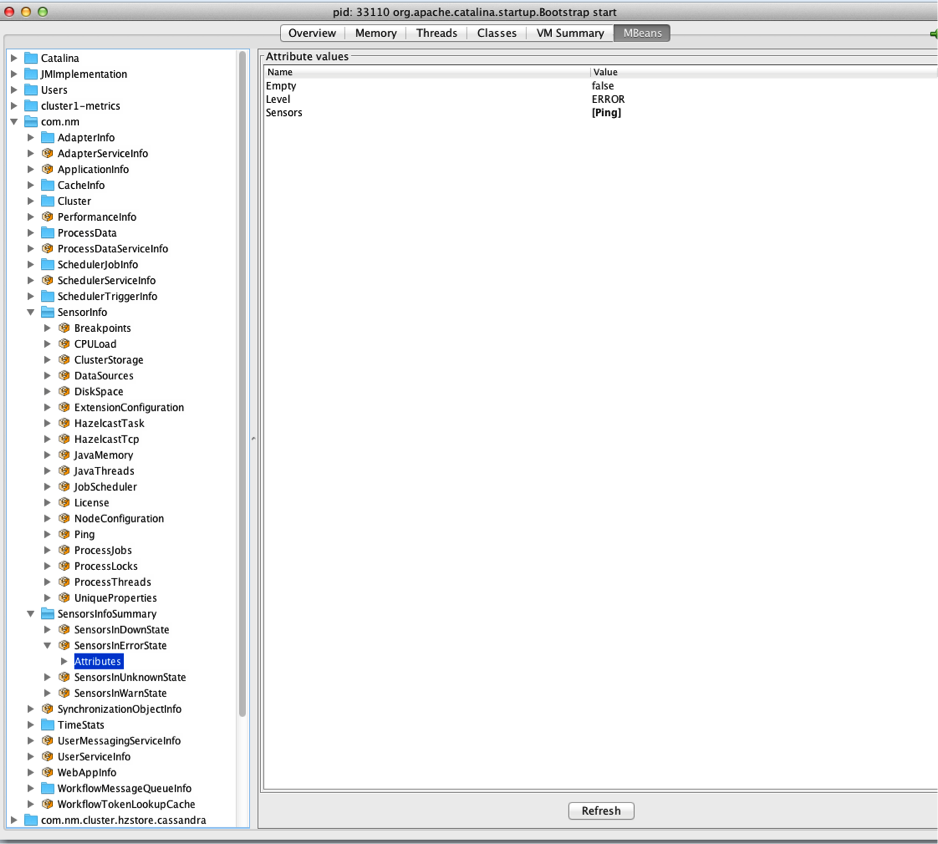
Every network Sensor collects some metrics which are reported via JMX under com.nm.extensions.systemhealthSensors.Sensors.cluster.connectivity. Every Sensor creates two beans for every collection:
- failures: count of the failures experienced
- values: contains the values of several attributes concerning the execution time and a counter:
- 50thPercentile
- 75thPercentile
- 95thPercentile
- 98thPercentile
- 99thPercentile
- 999thPercentile
- Max
- Min
- Mean
- StdDev
- Count
The Hazelcast Task Sensor creates just one folder related to itself (e.g. 127.0.0.1_5713). The Network Ping and Hazelcast TCP Sensor create one folder for every additional node in the cluster (e.g. 127.0.0.1_5714, 127.0.0.1_5715).
Network Ping Sensor
Each node tries to ping every other node in the cluster. Since Java exposes only the TCP and UDP network protocols (and not ICMP), the ping Sensor relies on java.net.InetAddress.isReachable(). This makes the code portable across different computer architectures and operating systems. First, the Sensor tries to perform a "ping" system call (ICMP ECHO REQUEST) and, if that fails, tries to open a TCP socket on port 7 (the echo service). This test succeeds if java.net.InetAddress.isReachable() returns true for all other nodes in the cluster before a timeout occurs and if no errors occur.
Note: The machines that are hosting FNZ Studio nodes need to allow ping requests for this Sensor to work correctly.
This Sensor is disabled by default, but you can enable the Sensor and set the ping timeout using the following properties:
SystemHealthSensors.PingSensor.enabledDefault:falseSystemHealthSensors.PingSensor.timeoutDefault: 1000 (ms)
| Overview | Value |
|---|---|
| Polling Interval | 10s |
| Thresholds | WARN: >0; ERROR: >2 |
| Messages | "Network connectivity is OK."; "172.18.1.29 could not ping 172.18.1.145. n172.18.1.29 could not ping 172.18.1.19.” |
Hazelcast TCP Sensor
Each node tries to establish a TCP connection with each other node. The destination port is the port running the Hazelcast server (5713 by default). This test succeeds if the TCP connection to all other nodes in the cluster can be established before a timeout occurs.
This Sensor is disabled by default, but you can enable the Sensor and set the TCP connection timeout using the following properties:
SystemHealthSensors.HazelcastTcpSensor.enabledDefault:falseSystemHealthSensors.HazelcastTcpSensor.timeoutDefault: 1000 (ms)
| Overview | Value |
|---|---|
| Polling Interval | 10s |
| Thresholds | WARN: >0; ERROR >2 |
| Messages | "Hazelcast TCP connectivity is OK."; "10.0.10.185:5713 could not connect to 10.0.10.185:5713.” |
Hazelcast Task Sensor
The Hazelcast Task Sensor checks the connectivity and health of Hazelcast. This Sensor tries to execute a lightweight distributed task. This test succeeds if each node returns the expected value within the expected time frame.
This Sensor is enabled by default. You can disable it or configure the Hazelcast probes timeout using the following properties:
SystemHealthSensors.HazelcastTaskSensor.enabledDefault:trueSystemHealthSensors.HazelcastTaskSensor.timeoutDefault: 2000 (ms)
| Overview | Value |
|---|---|
| Polling Interval | 10s |
| Thresholds | WARN: >0; ERROR >2 |
| Messages | "Hazelcast task probe is OK."; "3 consecutive errors have occurred. Backing off.” |
Category 'OS'
CPU Usage Sensor
The CPU Usage Sensor monitors the 1-minute CPU usage average.
The WARN and ERROR thresholds can be customized by changing the following properties of the System Health Sensors extension:
SystemHealthSensors.CpuUsage.warnLimitDefault: 60 (in percent)SystemHealthSensors.CpuUsage.errorLimitDefault: 80 (in percent)
When the CPU usage triggers the WARN or ERROR state level, the Sensor message contains details on the most expensive threads.
CPU Usage Meters
The CPU Usage Sensor delegates the computation of the CPU usage to the configured CPU usage meter. There are 2 implementations that can be used to measure the CPU Usage:
- JavaProcess
- SystemLoad
To change the default CPU usage meter, edit the following configuration property:
nm.system.health.cpu.usage.computation.typeDefault: javaprocess Possible values: javaprocess or systemload
Note: If the configured usage meter cannot compute the CPU load, the Sensor returns "-1".
JavaProcess CPU Usage Meter The JavaProcess CPU Usage Meter is a component that computes the CPU used by the process on which the Java virtual machine is running. The total used CPU time of the Java process is divided by the number of available CPU cores.
SystemLoad CPU Usage Meter The SystemLoad CPU Usage Meter component computes the CPU usage based on the system load average.
In simple terms, system load is the number of running or active threads. This number can be higher than the actual number of CPU cores, which means that some threads get CPU time while others have to wait. All threads are active (Java would show them in the "Running" state), but there are not enough CPU resources to perform all work in parallel.
The load average is the average system load over a period of time. A load average of 3.0 on a system with 4 CPU cores means that the system had an overall CPU usage of 75% during this time.
The load average always has to be seen in relation to the number of CPU cores, therefore it is impractical to use it for a comparison with threshold values.
This component reads the 1-minute system load average, divides this value by the number of CPU cores, and then multiplies it with 100%. The resulting value is capped at 100 and is independent of the number of CPU cores.
A value of exactly 100% means that the system was still able to handle all the work, but it was running exactly at its CPU capacity limit.
Note: The Java API used by this meter works only on Linux- or Unix-based systems. On Windows-based systems, it always returns "-1" for the system load.
| Overview | Value |
|---|---|
| Polling Interval | 1 minute |
| Thresholds | WARN: CPU load > 60%; ERROR: CPU load > 80% |
| Messages | "CPU usage average over the last minute is at 18%. The top 10 most expensive threads since then are: n(id=4) used: 307 ms hz.appway.1 (id=1) used: 102 ms n...The thread groups since then are: Other used: 307 ms hz.appway used: 120 ms" |
Disk Space Sensor
The Disk Space Sensor monitors the available free space in the Data Home directory. A lack of free space in the Data Home can have a negative impact on system stability and needs to be addressed immediately.
The Disk Space Sensor runs every fifteen minutes. The Sensor checks the amount of free space on the following partitions:
- The disk where FNZ Studio Data Home root directory is located.
- If any of the first level of directories located inside the Data Home is mounted on a different drive, its free space is also monitored.
- If any of the custom directories defined using the
SystemHealthSensors.DiskSpace.customDirectoriesconfiguration property is mounted on a different drive, its free space is also monitored.
The messages returned by the Sensor provide the following information for each monitored partition: path, free space in percent, and free space in Bytes. The percentage of free space is calculated by dividing the amount of usable space by the total size of the disk. "Usable" means that the Sensor estimates the amount of disk space that could be used by the JVM process, taking into consideration limitations such as disk quota or other operating system restrictions.
Besides passively monitoring the free disk space, the Sensor can actively assist you in freeing up space. If the Sensor goes into the ERROR state, it triggers the Data Home Cleaner job to try and recover from the ERROR state by compressing and deleting unneeded files. Note that the Data Home Cleaner job needs to be enabled for this mechanism to work.
The WARN and ERROR thresholds can be customized by changing the following properties of the System Health Sensors extension:
SystemHealthSensors.DiskSpace.warnLimitDefault: 10 (in percent)SystemHealthSensors.DiskSpace.errorLimitDefault: 1 (in percent)
| Overview | Value |
|---|---|
| Polling Interval | 15 minutes |
| Thresholds | WARN: free space < 10%; ERROR: free space < 1% |
| Messages | "Free disk space for file store /dev/xvda1 is at 37% (56 GB)" |
Data Home Cleaner Job
When enabled, the Data Home Cleaner job runs every month. In addition, the Data Home Cleaner job is triggered when the Disk Space Sensor status changes to ERROR.
Note: By default, the Data Home Cleaner job is disabled. Enable it by setting the SystemHealthSensors.DataHomeCleaner.enabled property to true (default: false).
When the Data Home Cleaner job runs, it cleans old files which are located in the conf and logs directories of the Data Home:
- In the
confdirectory, the job deletes backup files (e.g.conf.properties-Smith-20180110083000.backup) whose last modified date is older than three years. - In the
logsdirectory, the job compresses any log file to an individual ZIP file if the last modified date is older than three months. The ZIP file is then deleted when it is three years old.
The threshold ages governing the deletion of the configuration files, log files, and zipped log files can be configured using the following properties of the System Health Sensors extension:
SystemHealthSensors.DataHomeCleaner.backupConfFile.maxAgeDaysDefault: 1095 (in days)SystemHealthSensors.DataHomeCleaner.logFile.zipAfterDaysDefault: 90 (in days)SystemHealthSensors.DataHomeCleaner.logFile.maxAgeDaysDefault: 1095 (in days)
Note: The DataHomeCleanerJob logger is set to INFO by default to ensure that file deletion is logged.
Category 'Platform'
Data Sources Sensor
The Data Sources Sensor checks the availability of all data sources configured in FNZ Studio. Every data source has a “state script”, which is a piece of SQL code that is executed to check if the database is still alive.
FNZ Studio features two types of data sources:
- JDBC data sources are fully configured in FNZ Studio, including database driver and connection pool settings. The Sensor, therefore, is able to check the connection pool statistics and can generate an ERROR if the connection pool is exhausted, which means that all connections are currently in use and the pool is not allowed to grow.
- JNDI data sources are configured in the Java application server and only referenced by FNZ Studio. Connections are managed by the application server, and FNZ Studio does not have access to detailed information.
The Sensor can execute the state script for both types of data sources. The Sensor level is set to ERROR if the state check of at least one data source has failed and to WARN if they all have been successful but took more than 30 seconds for at least one data source.
| Overview | Value |
|---|---|
| Polling Interval | 5 minutes |
| Levels | ERROR: state check failed or connection pool exhaustednWARN: state check took more than 30 seconds |
| Messages | "No data sources configured."; "All data sources are operational."; "State check of data source ‘OracleP02’ has failed."; "Connection pool of data source ‘MySQL’ is exhausted." |
Job Scheduler Sensor
The Job Scheduler Sensor monitors several aspects of FNZ Studio’s built-in job scheduler:
- Is the job scheduler running, paused, or already shut down?
- If a job is currently being executed, how long has it already run?
- Has the scheduler missed starting a scheduled job?
The job scheduler is a Platform internal service. It is started when FNZ Studio is started and stopped when FNZ Studio is shut down. Studio users can pause and resume the job scheduler in the Job Scheduler administration tool. This Sensor will change to the WARN level if the job scheduler is currently paused and to the ERROR level if it has been shut down.
The job scheduler manages a set of worker threads (5, by default) to execute jobs. Whenever a job has to be executed, it is assigned to a free worker thread. Some jobs are executed in less than 5 seconds, while others need a minute or more to complete. The number of worker threads defines the maximum number of jobs the scheduler can execute in parallel. If all worker threads are busy executing long-running jobs, no other jobs can be started until at least one of the long-running jobs ends.
A single long-running job could be an indication of another underlying problem. Maybe the execution is blocked because the job has to wait for a lock currently held by another thread or it is waiting for a response from an external system. This Sensor, therefore, checks how long jobs have been running and reports jobs that have been active for more than 5 minutes (WARN) or even more than 1 hour (ERROR). The state description lists all threads running for more than 5 minutes. The Sensor level depends on the longest running thread.
This Sensor also checks if there is a job that has missed its scheduled execution date and is overdue for more than 5 minutes (WARN) or more than 1 hour (ERROR). This can happen if all worker threads are busy executing long-running jobs or if the main job scheduler thread has crashed, e.g. due to an out-of-memory error.
See Job Scheduling.
| Overview | Value |
|---|---|
| Polling Interval | 5 minutes |
| Thresholds | WARN: active/overdue time > 5 minutes; ERROR: active/overdue time > 1 hour |
| Messages | "Job ‘Temp Files Cleanup’ is already running since 13m 21s."; "Job ‘Update Database’ should have been started 1h 37m ago."; "Job scheduler is in stand-by mode."; "Job scheduler has been shutdown." |
Job Scheduler State Sensor
The Job Scheduler State Sensor verifies that all Quartz job schedulers on all nodes are in the same state.
For more information on the job scheduler functionality, see the preceding section.
| Overview | Value |
|---|---|
| Polling Interval | 5 minutes |
| Messages | "The schedulers are in identical state on all cluster nodes."; "Schedulers in running mode on nodes node1, node2; schedulers in standby mode on node node1."; "Job “Maintenance.Low Memory Check” present on node1 but not found on node2."; "Trigger “Maintenance Schedules.Memory Usage Schedule” (for job “Maintenance.Memory” Usage present on node1 but not found on node2."; "Trigger “Maintenance Schedules.Memory Usage Schedule” (for job “Maintenance.Memory”) has the property triggerType =org.quartz.impl.triggers.CronTriggerImpl on node1" |
Business Object Repository Sensor
Depending on how your Solution is set up and how long your system has been running, a Business Object can accumulate several versions (Business Object Versioning). Each of these Business Object versions occupies disk space and memory which can lead to performance issues if the number of versions passes certain thresholds. The Business Object Repository Sensor warns you if the number of versions of a Business Object reaches critical levels.
The WARN and ERROR thresholds can be customized in the configuration of the System Health Sensors extension using the following properties:
SystemHealthSensors.BusinessObjectRepository.warnLimitDefault: 100 (number of Business Object versions)SystemHealthSensors.BusinessObjectRepository.errorLimitDefault: 500 (number of Business Object versions)
When this Sensor notifies you of an issue, we recommend the following actions:
- Check if the versions of the affected Business Object have been created by human developers – or if the versions have been inadvertently created automatically, e.g. by updating a Catalog in a Process.
- Remove unused versions of the affected Business Object to free up disk space and ensure your system stays performing. To do so, use Obliteration.
| Overview | Value |
|---|---|
| Polling Interval | 1 hour |
| Thresholds | WARN: there are >100 versions of a Business Object; ERROR: there are >500 versions of a Business Object |
| Messages | "No business objects with too many versions found."; "Catalog 'TestCatalog' has 120 versions." |
Tracing Sensor
The Tracing Sensor monitors slow, deep, or large HTTP requests. FNZ Studio collects detailed information about what components use how much time during request processing, allowing administrators to identify performance bottlenecks.
You can configure the WARN thresholds for all three dimensions:
- Speed – Warn about requests taking longer than the defined threshold (default: 2000ms)
Configuration property:
nm.tracing.warnlimit.time - Depth – Warn about call trees deeper than than the defined threshold (default: 50 levels)
Configuration property:
nm.tracing.warnlimit.calltrees.depth - Size – Warn about call trees larger than the defined threshold (default: 40.000 nodes)
Configuration property:
nm.tracing.warnlimit.calltrees.nodecount
| Overview | Value |
|---|---|
| Polling Interval | 1 minutes |
| Thresholds | Speed: WARN: >2000, ERROR: >4000 Depth: WARN: >50, ERROR: >100 Size: WARN: >40.000, ERROR: >80.000 |
| Messages | "No slow, deep or large HTTP requests detected"; "Request 246 took 3000 ms."; "Call tree of request 246 is 60 levels deep."; "Call tree of request 246 has 50000 nodes." |
Extensions Sensor
The Extensions Sensor runs every minute and checks if all of the installed extensions are started. If at least one extension is not started, the Sensor changes to the WARN state. The Sensor never goes to the ERROR state.
| Overview | Value |
|---|---|
| Polling Interval | 1 minutes |
| Thresholds | WARN: >0 |
| Messages | "All extensions are currently started."; "Components (7.2.8) extension is currently stopped." |
Log Errors Sensor
The Log Errors Sensor runs every ten minutes and checks if errors were logged in the Cluster Log during the last hour. The Sensor changes to the WARN state if it detects at least one error; it changes to the ERROR state if the number of errors is greater than the value of the following property available in the configuration of the System Health Sensors extension:
SystemHealthSensors.LogErrors.errorcountDefault: 1000 Limits: If this property is set to a negative number or zero, the default value is used.
Note: This Sensors runs only on one node. The other nodes always display the message "Not executing this Sensor on this node of the cluster".
| Overview | Value |
|---|---|
| Polling Interval | 10 minutes |
| Thresholds | WARN: >0; ERROR: >1000 |
| Messages | "The logs contain no errors in the last hour."; "10 errors have been detected in the logs in the last hour."; "Not executing this Sensor on this node of the cluster." |
Garbage Collection Sensor
The Garbage Collection Sensor checks the overhead of Java Garbage Collection by monitoring that such overhead does not exceed the configured percentage. The Sensor runs every minute, and calculates three overhead values (in percent):
- Overhead for the past minute
- Average overhead for the past 5 minutes
- Average overhead for the past 15 minutes
The value used by the Sensor to trigger warnings and errors is the average overhead for the past 5 minutes. This protects the Sensor from being too sensitive to spikes or too slow to recover from an ERROR or WARN state, while retaining the necessary accuracy.
You can configure the thresholds (in percent) for WARN and ERROR states in the configuration of the System Health Sensors extension using the following properties:
SystemHealthSensors.GarbageCollection.warnLimitDefault: 5SystemHealthSensors.GarbageCollection.errorLimitDefault: 20
Note: Both WARN and ERROR limits have to be set to a value between one and one hundred.
| Overview | Value |
|---|---|
| Polling Interval | 1 minutes |
| Thresholds | WARN: >5%; ERROR: >20% |
| Messages | "Garbage Collection overhead is okay. (0.38%, 0.08%, 0.04%)." (averages for the past minute, 5 minutes, and 15 minutes) "Last 1 minute overhead is 48.14% Last 5 minutes overhead is 11.37% Last 15 minutes overhead is 3.94%"; "Last 1 minute overhead is 50.79% Last 5 minutes overhead is 21.26% Last 15 minutes overhead is 7.32%” |
Category 'Process Engine'
Process Locks Sensor
The Process Locks Sensor checks if there are any long-living process locks. These locks are cluster-wide and used to protect Process Instances against parallel modifications. Every thread has to always first acquire the lock for a Process Instance before it is allowed to make modifications to it.
There are several technical and non-technical reasons why process locks should not be held for more than a couple of seconds. This Sensor monitors the active locks, and the Sensor level changes to WARN if a lock is held for more than 2 minutes and to ERROR if a lock is held for more than 15 minutes.
Note: An overview of Process Locks is available in the Studio at Solution Maintenance > Process Engine > Process Locks.
| Overview | Value |
|---|---|
| Polling Interval | 1 minute |
| Thresholds | WARN: lock time > 2 minutes; ERROR: lock time > 15 minutes |
| Messages | "No long-living process locks."; "Process lock ‘1727363251812’ is locked since 3h 57m." |
Process Threads Sensor
The Process Engine maintains a set of worker threads for background activities. These threads are mainly used to update Process Instances, e.g. after a timer intermediate event has fired and the Process Token on this event may have moved on. By default, there are 5 Process threads. This Sensor checks if any of these threads has been working on the same Process Instance for more than 5 minutes (WARN) or even more than 1 hour (ERROR).
Long-running Process threads are often the reason for or a consequence of problems with Process locks. It is very likely that this Sensor will raise an alarm at the same time as the Process Locks Sensor.
Note: An overview of Process Threads is available in the Studio at Solution Maintenance > Process Engine > Process Threads.
| Process Threads Sensor Overview | Value |
|---|---|
| Polling Interval | 5 minutes |
| Thresholds | WARN: active time > 5 minutes; ERROR: active time > 1 hour |
| Messages | "No long-running process threads."; "Process thread 3 is active since 18m 46s."; "All process threads have been stopped." |
Process Jobs Sensor
FNZ Studio maintains a queue of Process jobs. Every Process job represents an operation to be performed on a particular Process Instance, such as “update process instance 137273828172” or “delete process instance 1425367782621”. These jobs are executed by the Process threads – a set of background threads managed by the Process engine. Whenever a Process thread has finished executing a Process job, it checks if the queue contains more Process jobs. If yes, it takes one job from the queue and executes it. If there are no more jobs in the queue, the Process thread simply waits for new jobs to appear.
Process jobs are created in different situations by different services and components of FNZ Studio, but since there is only a limited number of Process threads (by default 5), it can happen that the number of Process jobs added to the queue is more than the number of Process jobs the Process threads can execute within the same period of time. As a result, the queue will grow, and the Process threads will be active all the time, perhaps consuming a lot of CPU resources.
This Sensor monitors the age of the oldest Process job in the queue. The Sensor level changes to WARN if the oldest job is older than 5 minutes and to ERROR if it is older than 1 hour.
Note: An overview of Process Jobs is available in the Studio at Solution Maintenance > Process Engine > Process Jobs.
| Overview | Value |
|---|---|
| Polling Interval | 5 minutes |
| Thresholds | WARN: queue delay > 5 minutes; ERROR: queue delay > 1 hour |
| Messages | "No long-living process jobs in queue."; "Queue backlog: 15m 3s, process jobs in queue: 193" |
Process Message Queue Size Sensor
The Process Message Queue Size Sensor monitors the size of Process message queues (measured by the number of messages in a queue).
Note: An overview of Process Message Queues is available in the Studio at Solution Maintenance > Process Engine > Process Messages.
| Overview | Value |
|---|---|
| Polling Interval | 5 minutes |
| Thresholds | WARN: >500; ERROR: >1000 |
| Messages | "No long message queues detected."; "Queue queueName has size 850." |
Value Store Sizes Sensor
The size of a Value Store can become very large in real-life projects. Large Value Stores are very costly in terms of memory, network, and CPU, as FNZ Studio is based on a clustered architecture. This Sensor is designed to help monitor the size of Value Stores.
The Sensor state changes to WARN if at least one Value Store is larger than the WARN threshold, while it changes to ERROR if at least one Value Store is larger than the ERROR threshold.
These thresholds can be set in the configuration of the System Health Sensors extension using the following properties:
SystemHealthSensors.ValueStoreSize.warningsizebytesDefault: O,5 MBSystemHealthSensors.ValueStoreSize.errorsizebytesDefault: 2 MB
Note: The maximum value for the WARN threshold is 2MB. If the configured WARN threshold is larger than 2MB, the value is disregarded and 2MB is used as the WARN threshold instead.
The Sensor can automatically pause Process Instances that have a Value Store larger than the pause threshold if the enable property is set to true (default value). Make the according settings in the configuration of the System Health Sensors extension using the following properties:
SystemHealthSensors.ValueStoreSize.pauseprocessinstances.enabledDefault:true(starting from SystemHealthSensors Extension 5.1.2)SystemHealthSensors.ValueStoreSize.pauseprocessinstances.pausesizebytesDefault: 20 MB
Note: The pause size set in `pausesizebytes` needs to exceed the error size set in `errorsizebytes`. If this condition is not satisfied, the pause size is automatically set to two times the error size and a message is logged.
| Overview | Value |
|---|---|
| Polling Interval | 10 minutes |
| Thresholds | WARN: >524288; ERROR: >2097152 |
| Messages | "All value stores are within safe size limits."; "The value store for process instance 1541673007857 (ProcessNameTest) has exceeded the maximum recommended size. size=100.20MB." |
Category 'Script Language'
Breakpoints Sensor
Appway Script Language allows developers to set breakpoints that pause the execution of a piece of script code and allow a developer to check the state of execution at that point in the code. While this is a powerful feature during development, it can also be a source of problems on production systems or for people who are not aware of this feature. Suddenly, FNZ Studio does not respond to requests anymore and seems to hang, but in reality the thread has hit a breakpoint and is waiting for inspection.
This Sensor monitors if there are any active breakpoints set somewhere in script code. A single breakpoint is already enough to change the Sensor level to WARN. Furthermore, it also checks if there are any threads currently being blocked by an active breakpoint. The Sensor level changes to WARN if a thread has been waiting for more than 2 minutes and to ERROR after 10 minutes.
| Overview | Value |
|---|---|
| Polling Interval | 1 minute |
| Thresholds | WARN: blocked time > 2 minutes; ERROR: blocked time > 10 minutes |
| Messages | "No breakpoints enabled."; "3 breakpoints enabled."; "Thread 12 is blocked by a breakpoint since 4m 21s in Process AOP." |
Category 'Solution'
Packages Sensor
The Packages Sensor checks the IDs of the Packages available on your installation to ensure that no reserved Package IDs are being used. If there is a naming conflict which prevents the installation of a Platform Package, an ERROR is returned, other naming conflicts return a WARN message.
To rename a Package in case of a naming conflict:
- Create a new Package which does not use a reserved name.
- Move all Business Objects from the old Package to the new Package. To do so, use the Move functionality available on the Maintenance tab of your Package.
- Delete the old Package.
| Overview | Value |
|---|---|
| Polling Interval | 1 hour |
| Thresholds | WARN if a reserved Package ID is used.; ERROR if a Platform Package cannot be deployed due to the use of a reserved Package ID. |
| Messages |
"Package ID '[Package_ID]' is reserved. We recommend renaming the Package to avoid naming conflicts."; "FNZ Studio cannot deploy Package '[Package_ID]' because a Solution Package with the same ID exists. Rename the Solution Package and restart to install FNZ Studio Package."; "No Packages with reserved IDs." |
Unauthenticated Web APIs Sensor
The Unauthenticated Web APIs Sensor senso checks if there are any unauthenticated Web APIs in the system.
| Overview | Value |
|---|---|
| Polling Interval | Every day |
| Thresholds | WARN If the sensor finds at least one unauthenticated Web API. The Sensor never goes to ERROR state. |
If Web API is intended for public access (i.e. be unauthenticated), it should be excluded from the check by adding its name to the following property (in a comma-separated list), e.g.:
SystemHealthSensors.UnauthenticatedWebAPIs.excluded = Pkg1:UnauthApi1,Pkg2:UnauthApi2
Category 'System'
System Installation Sensor
This Sensor checks if there are any system installation aspects violating FNZ Studio's technical requirements or best practices. These aspects are outside of the control of FNZ Studio and its configuration, since they usually depend on the operating system configuration, Java installation, or application server settings:
- Java Version: The version of Java used to run FNZ Studio.
- Default Encoding: The default encoding of the JVM hosting FNZ Studio must be set to UTF-8.
The extension configuration property
SystemHealthSensors.SystemInstallation.DefaultEncoding.enabledcan be set tofalseto disable this check. - Servlet API: The version of the Servlet Specification implemented by the application server hosting FNZ Studio (must be at compatible with FNZ Studio version).
- Class Loading: Classes of libraries bundled with FNZ Studio must be loaded by the same class loader as FNZ Studio's core classes. Specifically, such classes should not be loaded from "shared libraries" provided by the application server.
- XML Parser: The XML parsers created by Java's XML APIs must be implementations provided by the Xerces-J library bundled with FNZ Studio.
- Font Subsystem: The font subsystem of the operating system must be configured so that Java AWT can load TrueType fonts and calculate accurate font metrics.
| Overview | Value |
|---|---|
| Polling Interval | 1 hour |
| Messages | No installation issues found.n[Other messages depend on the issue found, as outlined in the list above] |
Category 'Custom Script'
Custom Script Sensor
This Sensor is only available if the CustomSensors extension is installed. See CustomSensors Extension.
Jobs
Sensor State Cleaner Job
Sensor State Cleaner Job runs every 10 minutes by default, and it cleans the stale Sensor states, if any. The job schedule can be changed by updating the following property:
SystemHealthSensors.SensorStateCleaner.schedule = 0 0/10 * * * ?
This job is enabled by default, but it can be disabled by setting the following property to false:
SystemHealthSensors.SensorStateCleaner.enabled
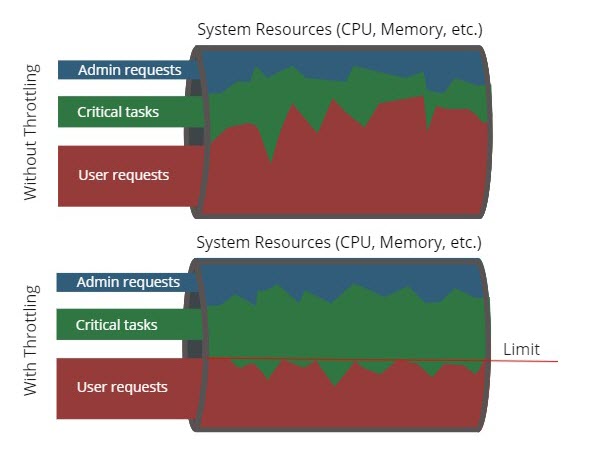
HTTP Request Throttling
HTTP request throttling is a tuning feature designed to help you keep your system stable when it starts to be overloaded.
Throttling slows down non-vital user requests when CPU usage is high, freeing up resources so that more important tasks have enough resources to be executed. Throttling does not drop incoming requests, but increases the response time for non-vital user requests meaning that less requests will be processed using less resources:
Requests considered as vital and therefore not subjected to HTTP request throttling are:
- All critical internal tasks, e.g. persistence tasks, Hazelcast tasks, jobs, etc.
- All requests that are executed by an Administrator.
HTTP request throttling relies on the CPU Usage Sensor to evaluate the CPU usage in the past minute. When the CPU usage exceeds the configured threshold, incoming non-vital HTTP requests are gradually slowed down in proportion to the CPU usage.
Note: If the CPU Usage Sensor is disabled, HTTP request throttling will not work.
HTTP request throttling is only available if the System Health Sensors extension is installed and it must be enabled by setting the following extension property to true:
SystemHealthSensors.Throttling.enabledDefault:false
Configuring HTTP Request Throttling
The CPU usage threshold after which throttling begins to be applied (meaning that the response time starts to increase for non-vital requests) is specified by the following extension property:
SystemHealthSensors.Throttling.threshold.percentage.lowDefault: 70
The counterpart of this property is the following extension property which specifies the maximum CPU usage threshold above which all non-vital requests are slowed down by the configured maximum wait time:
SystemHealthSensors.Throttling.threshold.percentage.highDefault: 90
The maximum wait time by which requests are slowed down is specified by the following property of the extension:
SystemHealthSensors.Throttling.max.wait.time.msDefault: 2000
Some examples of the total response time for non-vital HTTP requests when the properties explained above use the default values:
- When the current CPU usage is 75%, the total response time is: 500ms + time to execute the request
- When the current CPU usage is 80%, the total response time is: 1000ms + time to execute the request
- When the current CPU usage is 90%, the total response time is: 2000ms + time to execute the request
- When the current CPU usage is 95%, the total response time is: 2000ms + time to execute the request
Logging
If a Sensor level changes, the Sensor state change is logged through FNZ Studio’s logging facilities. The severity of the generated log message depends on the new Sensor level:
| New Sensor Level | Log Message Severity |
|---|---|
| OK | INFO |
| WARN | WARN |
| ERROR | ERROR |
| DOWN | ERROR |
Note: A Sensor state change is logged only if the level has changed. A change in the state description alone is not sufficient.
The log message is passed on to the logger
com.nm.monitoring.service.SystemHealthServiceImpl and has the following structure:
Sensor state changed: {OldState} -> {NewState}
The old and new state both have the following structure:
SensorState[{NodeName}/{SensorID} at {DateTime}: {Level} - {Description}]
Example log message:
Sensor state changed: SensorState[SMA-Node02/DiskSpace at 2015-04-19 14:38:07 +0200: OK - Free disk space is at 13% (33 GB)] -> SensorState[SMA-Node02/DiskSpace at 2015-04-21 03:31:48 +0200: WARN - Free disk space is at 8% (20 GB)]
Exposing the Status of System Health Sensors
There are two ways to expose the status of System Health Sensors:
- Using the Web API provided in the System Health Package
- Using JMX Integration
System Health Package
The System Health Package provides a ready-to-use Web API which exposes Sensor states of System Health to external systems. In addition, the Package includes a Screen showing how information on Sensor states could be displayed in a Process.
In detail, the System Health Package contains the following Business Objects:
- A fully defined and configured Web API (
Sensors_v1) which exposes the Sensor states of the System Health via theGetSensorStatesScript Function. - A Script Function (
GetSensorStates) that returns the most recent Sensor states for the requested Sensors. The Script Function can be set to query the Sensors before returning the result and is able to query Sensor states on all cluster nodes. This Script Function is exposed by the Web API. - A Screen (
ShowSensorStatesAsTable) displaying a list of all Sensors and their current states.
To add the System Health Package to your Platform installation:
- Download the System Health Package.
- Import the System Health Package (contained in the downloaded AWDEPLOYMENT file) from the Package Overview of FNZ Studio Composition. When importing, select the Package Configuration checkbox to include the configuration.
Querying the Web API
The Sensors_v1 Web API Business Object is defined to use the route /states and accepts the following parameters:
$query(Boolean) Set totrueto query the Sensors before returning the result. Default:false$SensorIds(String) Enter a comma-separated list of Sensor IDs if you want to query only a specific list of Sensor states. If omitted, the full list of Sensor states is returned.$distributed(Boolean) Set totrueto query the Sensor states on all cluster nodes. Applies only if FNZ Studio runs on multiple nodes. Default:false
Some example queries:
- To query the states of all Sensors without querying the Sensors first and without querying other cluster nodes:
<server>/api/SystemHealth/Sensors/v1/states?query=false&distributed=false - To query the DataSources, DataStore, and DiskSpace Sensors, query the Sensors before returning the result, and check the states on all nodes of the cluster:
<server>/api/SystemHealth/Sensors/v1/states?query=true&SensorIds=DataSources,DataStore,DiskSpace&distributed=true
The Package Configuration which was included when importing the System Health Package makes the Web API ready to use. Note that these configuration settings determine how the Web API can be used. For example, only users in the Administrator role can call the Web API and a CSRF header must be added to the request. In summary, the Web API is configured as follows:
- The Web API is activated
- Access Control – Only users in the Administrator role can call the Web API.
- Rate Limiting – A rate limit of 100 requests per minute is defined.
- Security Header - Cross Site Request Forgery (CSRF) – The CSRF Header is enabled, meaning that all requests must contain the header:
X-CSRF-Token: WebAPI. - Security Header - Cross Origin Resource Sharing – Disabled (external websites cannot query this Web API via AJAX calls)
See Sensor States.
JMX Integration for System Health Sensors
This chapter provides information on how the status of system health Sensors (for example, those related to CPU or disk space usage) is exposed through Java Management Extensions (JMX).
When the SystemHealthService is instantiated, one JMX Bean for each incorrect level (i.e., UNKNOWN, WARN, ERROR and DOWN) is registered. These beans provide summary information that can be easily decoded in order to gain an understanding about the overall system status (i.e., is the system healthy or is there any error?):
- Level of the Bean: UNKNOWN, WARN, ERROR or DOWN.
- Empty:
Trueif no Sensor has the above level,falseotherwise. - Sensors: List of Sensors whose level corresponds to the one of this Bean.
The Beans, which are available in the subdomain com.nm.SensorsInfoSummary, are:
| Name | Description |
|---|---|
| SensorsInDownState | Summary information about Sensors in DOWN state |
| SensorsI; ERRORState | Summary information about Sensors in ERROR state (see screenshot below) |
| SensorsInUnknownState | Summary information about Sensors in UNKNOWN state |
| SensorsInWarnState | Summary information about Sensors in WARN state |
Apart from providing a summary overview of the system, the state of each health Sensor is available in the com.nm.SensorInfo JMX subdomain. Sensors are registered to the underlying JMX infrastructure whenever they are added and unregistered when they are removed from the SystemHealthService.
The MBeans of the Sensors expose the following attributes:
| Name | Description |
|---|---|
| Category | The category to which the Sensor belongs, for example, “Cluster”. |
| Configuration | Configuration of the Sensor, for example, “Polling: 1m, WARN: >2m, ERROR: >10m”. |
| Description | Description of the Sensor. |
| DisplayName | The display name used in the UI. |
| ID | Unique identifier of the Sensor. |
| DownState | True if the state of this Sensor is DOWN, false otherwise. |
| ErrorState | True if the state of this Sensor is ERROR, false otherwise. |
| WarnState | True if the state of this Sensor is WARN, false otherwise. |
| UnknownState | True if the state of this Sensor is UNKNOWN, false otherwise. |
| ErrorLimit | The current limit for a state change to ERROR. |
| WarnLimit | The current limit for a state change to WARN. |
| Unit | The unit used for limits (‘s’ = seconds, ‘m’ = minutes, ‘h’ = hours, ‘d’ = days, ‘%’ = percentage, ‘c’ = count). |
| Running | True if this Sensor is running, false otherwise. |
| ResetSupported | True if the state of this Sensor can be reset, false otherwise. |
| LastState | Gets the last state of this Sensor, without querying. |
| PollingInterval | Polling interval for this Sensor, in seconds. |
| NextPollTime | Gets the time when the new state of this Sensor will be computed (UNIX time in milliseconds). |
The following operations are also exposed:
| Name | Description |
|---|---|
| Start | Starts this Sensor. If this Sensor is already running, this operation has no effect. |
| Stop | Stops this Sensor. If this Sensor is not running, this operation has no effect. |
| Reset | Resets the internal state of this Sensor. If the state of this Sensor cannot be reset, then this operation has no effect. |
| queryState | Queries this Sensor for its current state. |