Business Activity Monitoring (BAM)
This article covers the basic concepts and architecture of BAM, installation and configuration guidelines, and dashboard customization. Relevant recipes are listed at the end of the document.
Basic Concepts
This introductory chapter explains what Business Activity Monitoring (BAM) is, and how BAM can be used within FNZ Studio. It covers the suggested usage pattern of "Measure – Analyze – Monitor" and explains relevant concepts such as KPIs, scenarios and Service Level Agreements (SLAs).
Definition
Originally coined by analysts at Gartner Inc., business activity monitoring (BAM) refers to the aggregation, analysis and presentation of real-time information about operations, processes and transactions inside organizations, as well as those involving customers and partners.
BAM is an enterprise solution that provides a real-time summary of business activities to operations managers and upper management. Using BAM enables an enterprise to make better-informed business decisions, address problem areas quickly, and re-position itself to take full advantage of emerging opportunities.
In line with this definition, FNZ Studio's BAM provides managers with real-time visibility and process control over FNZ Studio instances. By monitoring business data and events, managers can identify process issues and successes and initiate action as appropriate.
Usage Steps
This section outlines the suggested usage pattern for the FNZ Studio's BAM product, as seen in the figure below:
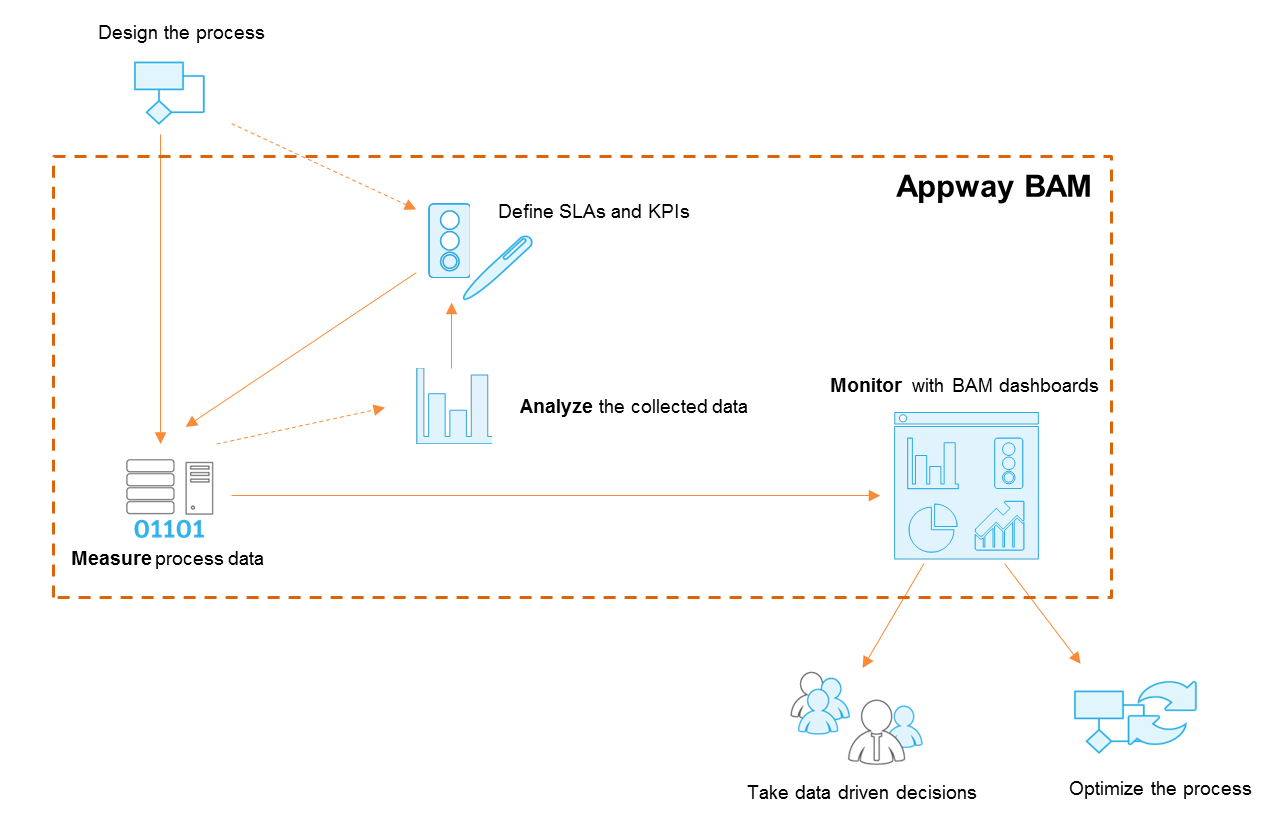
BAM Usage Steps overview
A defined business process is a prerequisite for using BAM. An FNZ Studio business process design (where process activities are defined and organized in sequence) must be in place before the FNZ Studio's BAM can be configured and used.
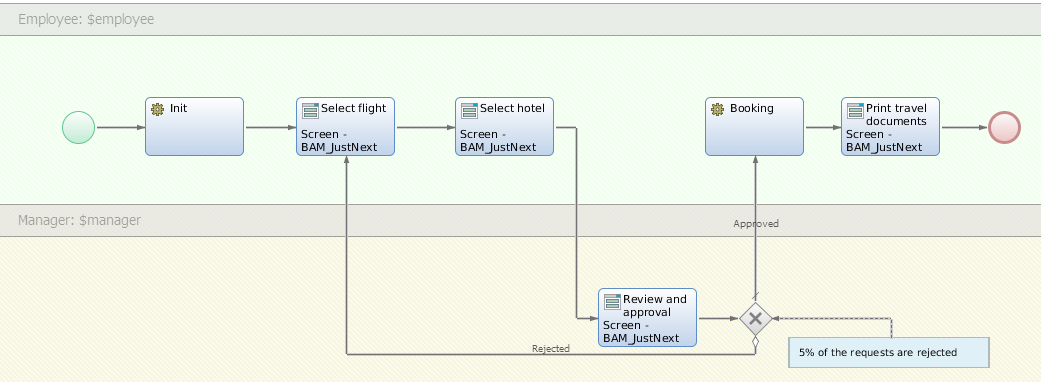
Example definition of a business process
The suggested usage pattern for the FNZ Studio's BAM spans three stages: measure, analyze and monitor.
Measure
Process Measurement Options
In the first stage, measure, the user identifies and marks the set of processes and activities to be monitored. Please note that deciding which activities are to be measured is a mandatory step as no information is recorded by default.
When processes and activities are executed in the workspace, BAM measures all the processes and activities previously marked and saves the data in a database. Measurement includes all runtime information about when a process/ activity was started, who worked on it, when it was completed and so on.
Additional custom business indicators for a specific process type and/or domain can also be created: It might be useful to monitor and filter specific processes by market or region, for example. Or it might be useful to track a certain monetary amount being recorded in the process in order to compute trends and aggregate values. These custom business indicators are also referred to as "Key Performance Indicators" (KPIs) in FNZ Studio's BAM terminology. The creation of KPIs is optional and can also be performed at a later date.
Key Performance Indicators (KPIs)
In order to set KPIs, use Script Functions BAM:SetProcessInstanceKPIs and BAM:SetProcessTokenKPIs (see Process Functions). Alternatively, Trackpoints can also be used, but they allow only setting KPIs one by one, which can have performance impacts when storing multiple KPIs.
Note that trackpoints are saved directly to the BAM database, and they do not correspond to process instance or token attributes. If you are migrating from v2.0 or v3.0 of the BAM extension, see the Monitor section.
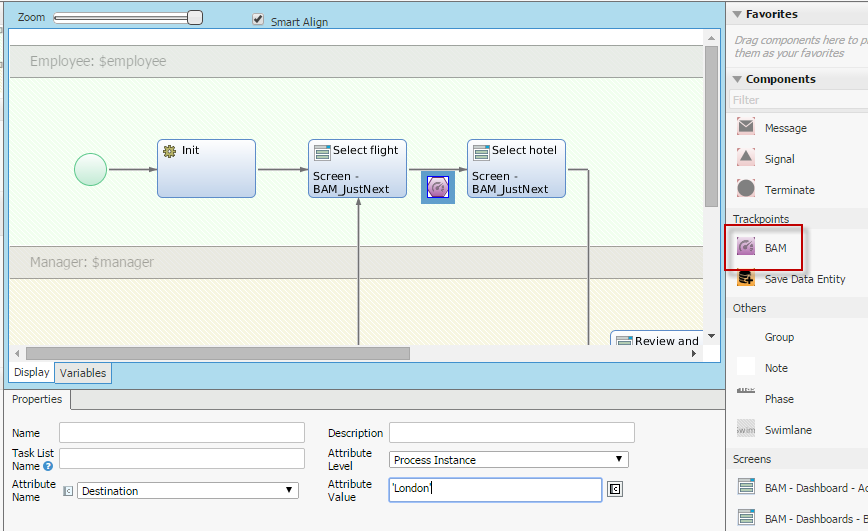
A BAM trackpoint in the process modeler
Analyze
Once the first stage, "measure", has been implemented, users can move to the next stage to analyze and review the data that is being recorded. This could be weeks or months after BAM has been installed and configured. Reviewing the data collected provides an insight into process and activity duration patterns, and assists in setting or amending expected duration(s) based on these patterns. Note that the depth of analysis is dependent on the length of time that BAM has been running.
Running processes can be measured against predefined durations in order to identify violations and trends. The FNZ Studio's BAM provides aggregated indicators of process and activity duration. These indicators (median, average, maximum and minimum) can serve as a baseline when setting expected durations.
Setting or amending expected durations and SLAs is an entirely optional step, and one which can be postponed to a later date or iteration. As expected durations and SLAs are powerful tools in determining the overall performance of a process and in identifying bottlenecks and optimization points, the decision to omit this step should be considered carefully.
If the user is not interested in analyzing the collected data to set SLAs, this step may be omitted and the user may proceed directly to the last stage, "monitor".
Service Level Agreements
Service Level Agreements (SLAs) can be thought of as "contracts" between the service requestor and the service provider, defining the maximum expected/allowed time for the completion of activities. SLA task status within BAM is shown to users and managers. Managers have an overview of overall task statuses while users can use this indication in order to (re)act appropriately on urgent tasks assigned to them.
Note: SLAs existing prior to installation of FNZ Studio's BAM can be configured directly. SLAs can also be applied once FNZ Studio's BAM has been running for a period of time (days, weeks, months) and data on the selected processes has been collected.
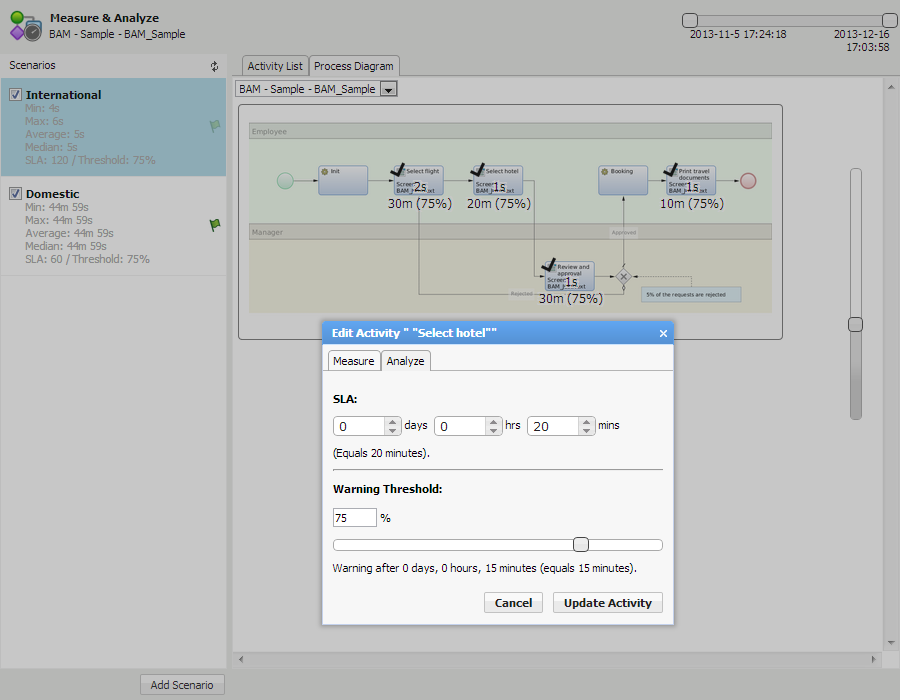
Setting an SLA on an activity using the FNZ Studio's BAM
SLAs can be specified on two different levels: process SLA and activity SLA. A process SLA refers to the expected duration of an overall process, for example, "client onboarding" or "Know Your Customer (KYC)". An activity SLA is the expected duration of one sub-activity of the process, such as entering client information.
FNZ Studio's BAM does not force the SLA of a process to be the sum of its sub-activities. Therefore, a "buffer" SLA can be considered on the process duration. Furthermore, the SLA status of an activity is not necessarily the same as the SLA status of the process containing the activity. For example, an activity may be on time, but the overall process already overdue. On the other hand, a single activity may be overdue, but if the overall process has just started, the process may still be on time.
Users can specify a tolerance threshold for each activity and process SLA. Provided as a percentage of the SLA, this value indicates when the activity or process should produce a warning. If a threshold is specified, users can react to warnings and take action before the SLA expires.
The actions that occur once a specific activity or process expires are defined on a case-by-case basis. Examples include sending out notification emails to interested parties, applying reassignment rules to redistribute the workload, or activating escalation mechanisms for immediate reaction. No predefined actions or rules are specified in the FNZ Studio's BAM: its role is to identify and mark activities and processes that are expired.
Weekends and public holidays can be excluded from process and activity SLA computation. This means that if a public holiday or a weekend falls between the start time and the expected completion time of an activity, the time available is duly extended by the number of weekend and vacation days that occur in the interval so that only effective business days are considered in the SLA.
Scenarios
Certain activities or processes could have different expected durations dependent on the circumstances. For example, opening a joint account could take longer than opening an individual account, as multiple parties are involved. In such cases it is important to be able to specify a different SLA for the process and the activities required for the two different circumstances, that is, making the SLA durations dependent on process variations.
FNZ Studio's BAM uses the concept of a "scenario" to implement this requirement. A scenario is a defined set of process instance characteristics that determines a specific execution path in the flow. In the example below, the type of account defines the flow within the account opening process.
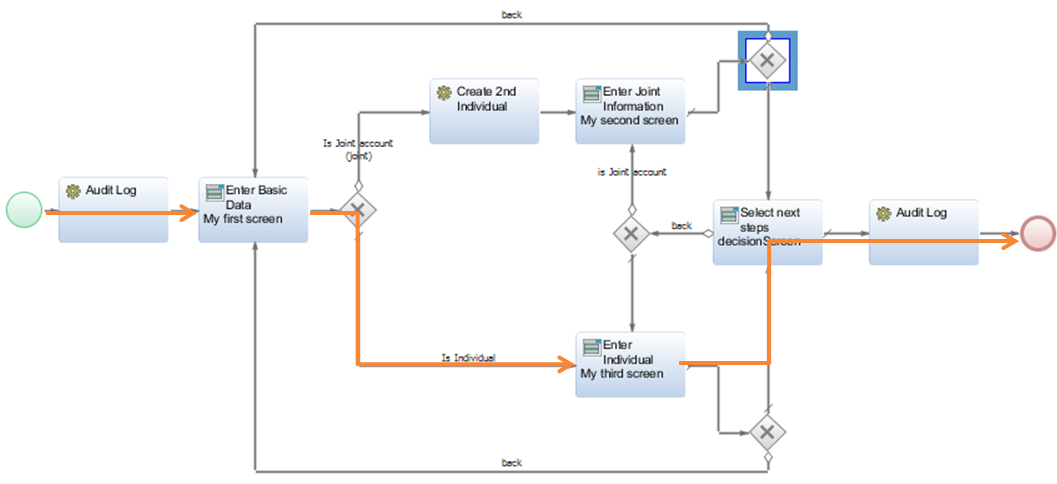
Example of scenarios inside an account opening process
BAM allows the user to specify different scenarios for a process, along with different process and activity SLAs for each scenario defined. Users can also select a default scenario for a process, which will then apply to all new instances of that process.
Scenarios can be easily set/changed in a process instance by invoking a script function (SetProcessSLAScenario) provided by the BAM extension. After a scenario is set, the SLA status of the process instance is updated to match the new scenario SLA. All sub-activities started after a change in scenario use the new activity SLAs.
Scenario concepts can also be used to decide when an activity or process should be measured and stored in the DB, and when it should be ignored.
Monitor
FNZ Studio's BAM contains dashboards where the user can monitor the status of processes. The dashboards provide a rich interface for monitoring, filtering and reporting. SLAs and KPIs, if set, can also be monitored, filtered and aggregated in the dashboards.
The dashboards assist BAM users in taking data-driven decisions on team resizing, task reassignment and workload management rather than relying on intuition or opinion-based decisions. Users can also identify bottlenecks and optimization points in the process, and start a new design iteration towards optimal process efficiency.
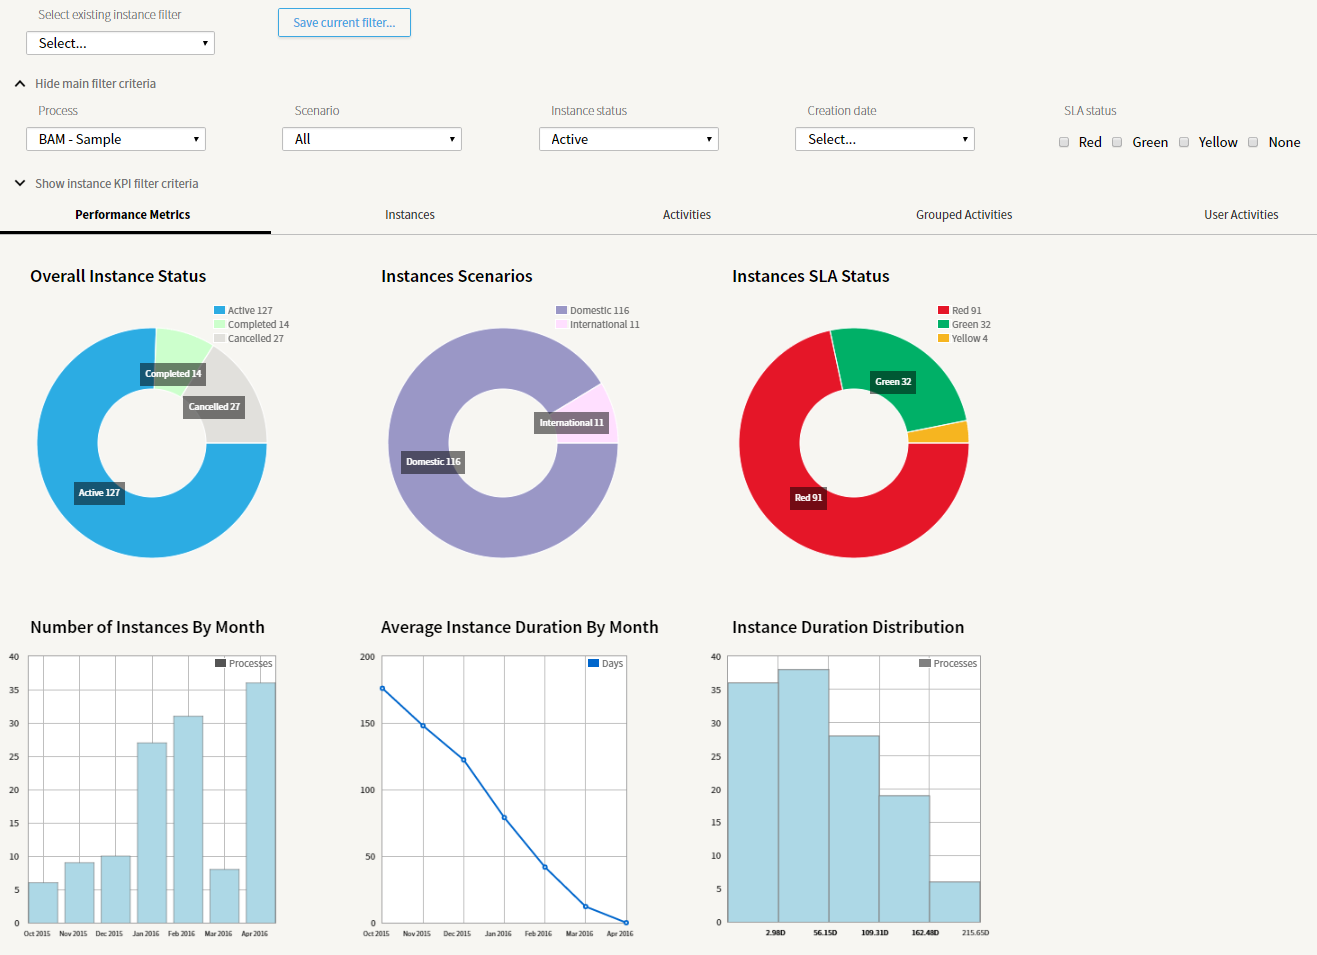
Process monitoring using the BAM dashboards
FNZ Studio's BAM provides out-of-the-box dashboards for monitoring the status of instances, activities, and SLAs. Out-of-the box dashboards also aggregate processes and activity indicators, and can generate reports on the available data via MS Excel.
The dashboards offer a drill-down feature: From the general overview, users can navigate to specific lists of filtered processes, then down to single instances and their sub-activities. Advanced data filtering capabilities allow quick identification of relevant subsets of instances and activities for aggregation or reporting purposes. A set of predefined clickable charts that provide a general overview of overall system status are also included.
The basic out-of-the-box dashboards come with the BAM extension and are implemented using FNZ Studio screens and processes. Deployed using the standard content import feature, the dashboards are fully customizable according to specific project needs:
- Graphical and layout adjustments
- Addition of custom charts
- Modification of existing charts
- Extension of report tables
- Any other change supported by FNZ Studio screen designs
Installation and Configuration
A database must be set up before BAM is installed. This chapter covers database set up, followed by BAM installation, and information on how to configure the BAM extension itself. Information on how to install and configure the Dashboards can be found in the Out-of-the-Box Dashboards section.
Database Setup
BAM is delivered as an FNZ Studio permanent extension. A prerequisite for its installation is the creation of a database and its setup in FNZ Studio.
For a list of supported databases, see the Technical Requirements article.
Consider that H2 can only be used for prototype and showcase environments such as proofs of concept. To set up an H2 database in FNZ Studio, please follow the instructions found in the Data Sources article.
A dedicated database instance/schema must be created before starting BAM extension setup. The database user must have:
- Connect, select, insert and update rights
- Table and index creation rights
- Procedure creation and invocation rights
- Unlimited tablespace quota
Once the schema is created, an FNZ Studio Data Source that points to the newly created database must be set up. Instructions on setting up Data Sources in FNZ Studio can also be found in the Data Sources article. The name of the FNZ Studio Data Source used for BAM is not relevant and can be any valid data source name.
After the creation of the Data Source, the BAM extension can be uploaded to the FNZ Studio environment. Once the extension has been uploaded, it is necessary to restart FNZ Studio in order for the BAM extension to start up. Note that, as BAM is a permanent extension, it is not possible to install or upgrade it while FNZ Studio is running.
Initial BAM Extension Configuration
After BAM extension startup, a new BAM sub-module appears under System Configuration. This contains a configuration page, BAM Installation, that allows the user to set up and manage the database content.
Note: If the Permissions functionality is licensed, only users with the permission BAMAdministrator have access to the BAM configuration page. If the permissions functionality is not licensed, all users with Studio access can access the BAM configuration page.
First, select the data source name and database type in the top section of the BAM Installation page. Click Update.
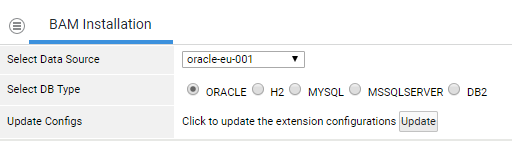
Database configuration in the BAM Installation page
FNZ Studio will then check if the BAM database tables are present. During the initial configuration these will be missing, producing a set of warnings.
Next, set up all the database tables and indexes that are used to store BAM data: In the Actions section of the BAM Installation page, click on the Create button. This will create all necessary tables in the BAM database.
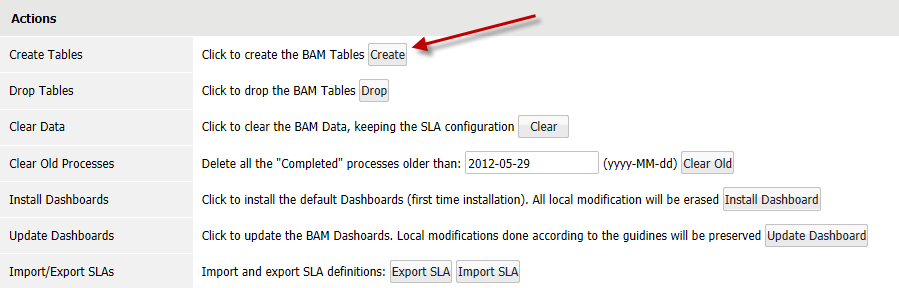
Actions available on the BAM Installation page
Other additional features found in the Actions area (non-mandatory during installation):
| Button | Description |
|---|---|
| Clear | Deletes all BAM data. Preserves the table definition and the SLA values. |
| Clear Old | Deletes of all the Completed and Cancelled process instances older than a specified date. Preserves the table definition and the SLA values. |
| Install Dashboards |
Imports the out-of-the-box BAM dashboards shipped with the extension. The button opens the standard import interface in order to check the result of the import and resolve any conflict. This button is used for the initial installation of the out-of-the-box dashboards; it imports all content including the dashboard templates and the default settings. More information can be found in the Out-of-the-box Dashboards section. |
| Update Dashboards |
Updates the out-of-the-box BAM dashboards shipped with the extension. The button opens the standard import interface in order to check the result of the import and resolve any conflicts. This button is used when updating the out-of-the-box dashboards to the latest version available after having installed the new version of the BAM extension. It imports the dashboard templates only and preserves local modifications to the settings done according to the guidelines. More information can be found in the Out-of-the-box Dashboards section. |
| Import/Export SLAs |
These buttons allow the user to export all SLA definitions from an environment and then import them in bulk into another environment, for example, when moving from the development (DEV) to the production (PROD) environment. Export SLA: Generates an .sla file and allows the user to save it to the local drive. Import SLA: Lets the user import existing .sla files from the local drive into the FNZ Studio environment. The import operation will override all SLA definitions related to processes that are contained in the .sla file. |
The final section of the installation page presents a summary of the BAM tables with the number of records for each. The first four tables contain runtime data of processes and activities. The last two tables contain SLA values for processes and activities.
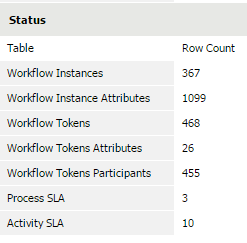
Database status with counters available in the BAM Installation page
Additional Configuration
Some additional configuration properties can be specified in the extension configuration. It is not necessary to restart FNZ Studio in order for the BAM extension to take up changes to these properties, as they are applied immediately when the properties are saved. These include:
| Property | Default value | Description |
|---|---|---|
| worklist.attributes | * |
Allows the user to specify which process instance attributes should be considered BAM-relevant and therefore saved in the BAM database.
All attributes (excluding BAM-generated ones) are saved by default (worklist.attributes=*). If this property contains a comma-separated list of attribute names, only the listed attributes are saved.
This parameter is only applicable if the configuration property bam.instance.attributes.enabled and/or the bam.token.attributes.enabled parameters are set to true.
|
| bam.ignoreAttributes | empty |
Lets the user specify non-BAM-relevant process instance attributes.
This parameter contains a comma-separated list of attributes to be ignored.
The following attributes are always ignored:
bam.instance.attributes.enabled and/or the bam.token.attributes.enabled parameters are set to true.
|
| bam.log.level | ERROR | Allows the user to specify the log level for all BAM extension classes on extension startup (requires an FNZ Studio restart). |
| bam.screen.task.enabled | true | Enables/disables screen task recording in the BAM extension. |
| bam.intermediate.events.enabled | false |
Enables/disables recording of intermediate events in the BAM extension:
|
| bam.listener.priority | 95 | Allows the user to specify the priority used when triggering the process listener in order to coordinate interaction with other extensions such as the Offline Worklist. |
| bam.instance.attributes.enabled | false | Enables/disables saving of standard process instance attributes as BAM KPIs. This is an alternative method to using trackpoints (see Trackpoints section for details). |
| bam.token.attributes.enabled | false | Enables/disables saving of standard process token attributes as BAM KPIs. This is an alternative method to using trackpoints (see Trackpoints for details). |
| bam.sla.skip.weekends | false | Enables/disables exclusion of weekends from SLA computation. |
| bam.sla.skip.public.holidays | false | Enables/disables exclusion of public holidays from SLA computation. The list of public holidays to be excluded is read from the extension configuration property bam.holidays. |
| bam.holidays | 2014-01-01, 2014-12-25 | Comma-separated list of holidays to be excluded from SLA computation — but only if the extension configuration property bam.sla.skip.public.holidays is set to true. The dates must be specified in the format yyyy-mm-dd. |
| bam.holidays.xxx (e.g. bam.holidays.zurich, bam.holidays.ticino) | -- |
Comma-separated list of region-specific holidays to be excluded from SLA computation, in addition to the ones in bam.holidays — only if the extension configuration property bam.sla.skip.public.holidays is set to true.
The dates must be specified in the format yyyy-mm-dd.
The region to be used can be specified at the process instance level using the instance attribute bam.holidays.region, or at the single activity (token) level using the token attribute bam.holidays.region.
If both attributes (instance and token level) are specified for a given token, the one at the token level is used.
The content of the instance/token attribute must match the last part of the desired configuration property name (e.g. “zurich”).
When the instance attribute bam.holidays.region is set, the SLA for the process instance is immediately updated to consider the region holidays (if any); the change is also applied to all new tokens created inside the instance after the attribute has been set.
If the token attribute bam.holidays.region is set instead, the selected region's holidays are considered for the SLA computation of all new tokens created after the one where the attribute was set and where the token attribute is propagated according to the process engine rules.
|
| bam.team.assignment.tracking.enabled | true | Enables/disables saving assignments of a token to GROUP: or ROLE: as team of the current token. |
Architecture
BAM Modules
The FNZ Studio's BAM is composed of different modules:
- The Measure and Analyze tool
- A process listener
- Extraction functions
- Out-of-the-box dashboards
- Database storage (BAM DB)
Section 3.1 outlines the first four modules; the BAM DB module is covered in the Database Structure section.
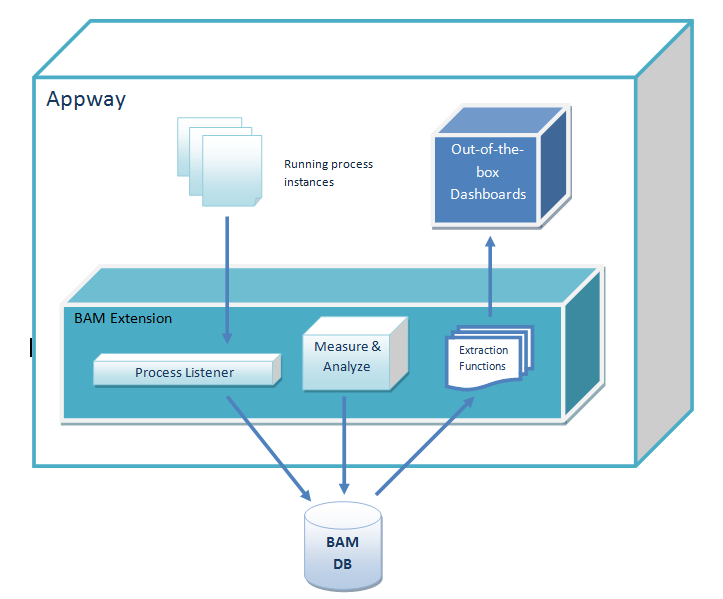
High-level description of the interaction and data flow among the components
Measure & Analyze Tool
The Measure & Analyze tool is the first access point for BAM. The tool lets the user select which processes and activities should be measured by BAM — that is, saved in dedicated tables in the BAM DB. The user can also use the tool to set the SLA values for all relevant processes and activities.
The table BAM_ProcessSLA contains the SLA values for processes. The table BAM_ActivitySLA contains the SLA values for activities. These tables are covered in more detail in the SLA Tables section.
The Measure and Analyze tool also presents aggregated duration values for processes and activities. These values provide contextual information useful when deciding upon SLAs.
Process Listener
The second component is the process listener. The process listener is able to intercept events occurring in the FNZ Studio process engine related to running process instances. It records these events in the BAM DB. Example events include starting a new process instance, reassigning a process instance, completing a process instance, and so on.
As events are recorded in the BAM DB, it is then possible to run queries against this runtime data and display the results in the dashboards. Please note that the listener only records data for processes and activities that have the "Measure" flag marked in the Measure & Analyze tool. All other processes and activities are ignored. An SLA is not mandatory for recording processes and activities, meaning that it is possible to start measuring before providing an SLA.
In addition to recording basic runtime data, the process listener computes the expiration and warning time for each process and activity. The expiration time is computed as 'starting time + SLA'. The warning time is computed as 'starting time + (SLA*threshold)'. These expiration and warning times are saved in the BAM DB together with the standard runtime data.
In addition, the listener also sets these times as process and token attributes on the processes and activities. The process attributes are processExpirationTime and processWarningTime. The activity attributes are activityExpirationTime and activityWarningTime. All values are saved as timestamps (long numbers). If an SLA has not been provided, all attributes — and the SLA itself — are set to 0.
Any error in the execution of the process listener actions (for example, database is down while trying to save a newly created instance) does not block the normal execution of the process, and the user is not notified about it. In this case, the error is logged to the FNZ Studio error log, and the query is not retried (data loss is possible).
Extraction Functions
The third module, 'extraction functions', contains a set of FNZ Studio functions that can be used in the Appway scripting language to execute standard extraction queries on the BAM DB. These functions are implemented in the BAM extension using direct SQL queries and Java code. The code is not available/editable from the FNZ Studio Composition. Example functions include:
- Computing the average instance duration by month
- Counting the number of instances by scenario
- Retrieving the warning time for an activity
The full list with details for each function is provided in the Functions section.
Out-of-the-box Dashboards
The fourth component is the out-of-the-box dashboards. Unlike all the other components described above (which are built in the extension source code), this module is built in the FNZ Studio Composition using standard Business Objects (screens, processes, labels, and so on). Dashboards can therefore be fully adapted and customized.
The dashboards invoke the extraction functions in order to retrieve data from the BAM DB and display it using tables and charts.
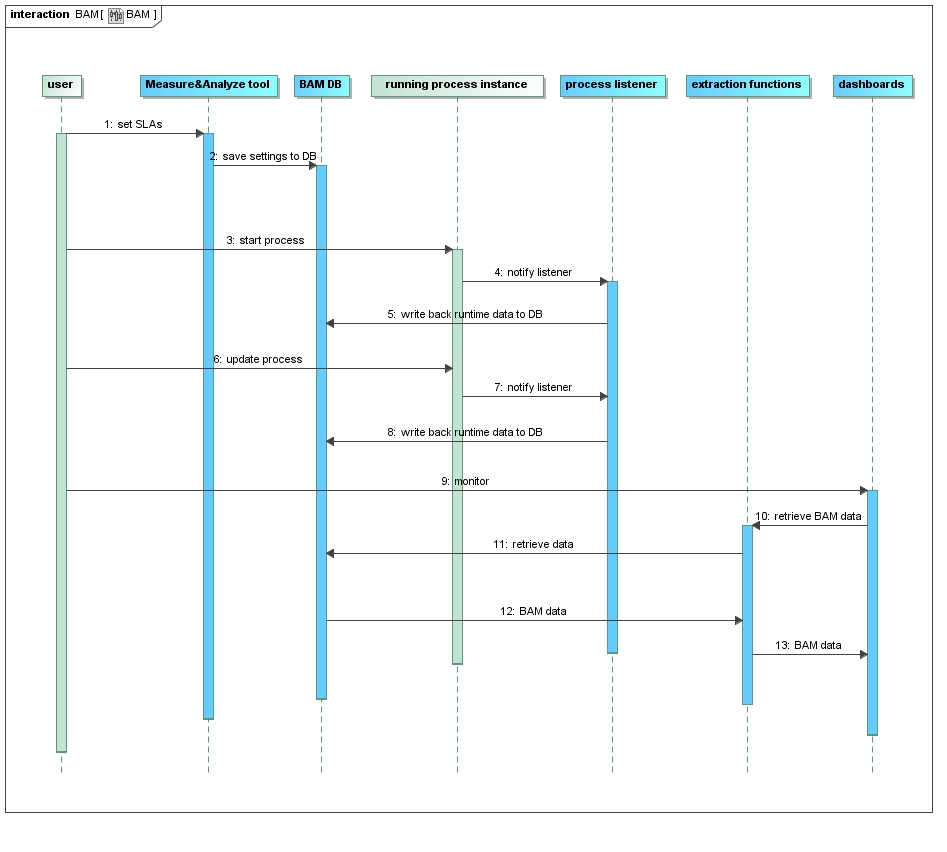
Sequence diagram illustrating the interaction among the different actors in a typical BAM usage scenario
Database Structure
The BAM DB includes tables that store runtime process and activity data, and SLA values. The schema includes seven tables: two dedicated to SLAs, and five dedicated to runtime data.
SLA Tables
BAM_ProcessSLA: contains process SLAs and thresholdsBAM_ActivitySLA: contains activity SLAs and thresholds
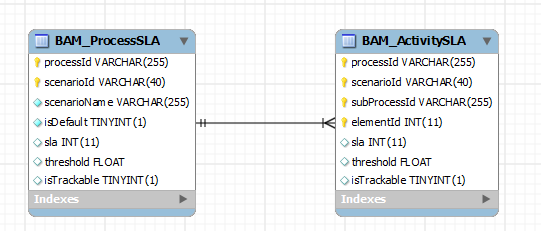
FNZ Studio's BAM database schema (SLA tables)
The BAM_ProcessSLA table contains one row for each process and scenario pair. The primary key of the table is (processId,scenarioId).
| Column Name | Data Type | Description |
|---|---|---|
| processId | string | Process ID ('AccountOpening', 'ApprovalRequest') |
| scenarioId | string | Scenario ID ('indiv', 'joint') |
| scenarioName | string | Scenario name ('Individual', 'Joint') |
| isDefault | integer 0/1 | Flag to mark default scenario for a process |
| sla | number | SLA value in minutes |
| threshold | decimal number between 0 and 1 | Threshold value |
| isTrackable | integer 0/1 | Flag to mark if scenarios should be measured |
Table 3: BAM_ProcessSLA table
The BAM_ActivitySLA table contains one row for each activity, process and scenario set. The primary key of the table is (processId,scenarioId,subProcessId,elementId). Together, subProcessId and elementId identify an activity inside a process. There is a foreign key reference to the (processId,scenarioId) key in BAM_ProcessSLA.
| Column Name | Data Type | Description |
|---|---|---|
| processId | string | Process ID ('AccountOpening', 'ApprovalRequest') |
| scenarioId | string | Scenario ID ('indiv', 'joint') |
| subProcessId | string | Subprocess ID ('SearchClient') |
| elementId | string | ID of the activity within the process/sub-process |
| sla | number | SLA value in minutes |
| threshold | decimal number between 0 and 1 | Threshold value |
| isTrackable | integer 0/1 | Flag to mark if activity should be measured |
Table 4: BAM_ActivitySLA table
Runtime Data Tables
There are five runtime data tables:
BAM_WorkflowInstancescontains runtime data of process instancesBAM_WorkflowInstanceAttributescontains process instance KPIsBAM_WorkflowTokenscontains runtime data of process tokens (activities)BAM_WorkflowTokenAttributescontains process token KPIsBAM_WorkflowTokenParticipantscontains process token participants
The definition includes appropriate database indexes for each table. No foreign key constraint is applied to these five tables.
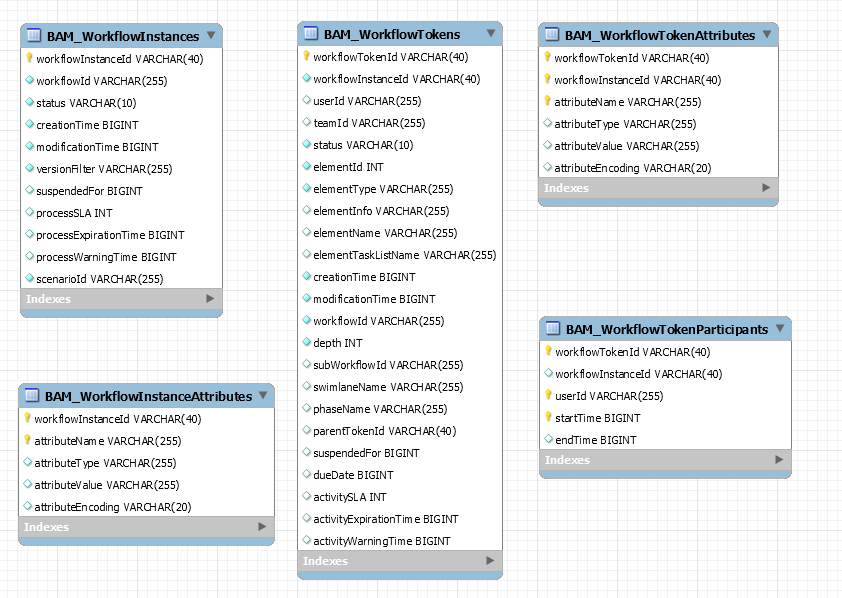
FNZ Studio's BAM database schema (runtime data tables)
BAM_WorkflowInstances
The BAM_WorkflowInstances table contains one row for each BAM-relevant process instance (SLA defined, and different to 0). The primary key of the table is the workflowInstanceId.
| Column Name | Data Type | Description |
|---|---|---|
| workflowInstanceId | string | Process instance ID ('12345678') |
| workflowId | string | Process ID ('AccountOpening') |
| status | 'Active'|'Cancelled'|'Completed'|'Suspended'
|
Process instance status |
| creationTime | timestamp number | Creation time of the process instance |
| modificationTime | timestamp number | Modification time of the process instance |
| versionFilter | string | Version filter attached to the process instance ('TimestampFilter-13669808123', 'HeadFilter-permanent') |
| suspendedFor | number in milliseconds | The total amount of time during which the process instance was in status Suspended |
| processSLA | number in minutes | Current SLA of the process, dependent on the current scenario. If no SLA has been set, the number is equal to 0. |
| processExpirationTime | timestamp number | Expiration time for the process dependent on the current SLA. This is computed as 'creationTime + SLA'. If no SLA has been set, this is equal to 0. |
| processWarningTime | timestamp number | Warning time for the process, dependent on the current SLA and threshold. This is computed as creationTime + (SLA*threshold). If no SLA has been set, this is equal to 0. |
| scenarioId | string | Current scenario ID for the process instance. If this ID is updated, processSLA, processExpirationTime and processWarningTime also update automatically. |
Table 5: BAM_WorkflowInstances table
BAM_WorkflowInstanceAttributes
The BAM_WorkflowInstanceAttributes table contains one row for each BAM-relevant process instance and instance attribute. The primary key of the table is (workflowInstanceId,attributeName).
| Column Name | Data Type | Description |
|---|---|---|
| workflowInstanceId | string | Process instance ID ('12345678') |
| attributeName | string | Name of the process instance KPI ('clientRegion') |
| attributeType | string | KPI value type ('java.lang.String') |
| attributeValue | string | Process instance KPI value ('EMEA') |
| attributeEncoding | string | Encoding of the KPI value, if any |
Table 6: BAM_WorkflowInstanceAttributes table
BAM_WorkflowTokens
The BAM_WorkflowTokens table contains one row for each BAM-relevant process token (activity). The primary key of the table is workflowTokenId.
| Column Name | Data Type | Description |
|---|---|---|
| workflowTokenId | string | Process token ID ('12345678') |
| workflowInstanceId | string | Process instance ID ('1234321') |
| userId | string | Current activity owner ID ('NM', 'Peter') |
| teamId | string | Current owner team of the token. By default, this column contains the name of the swimlane where the process token is located (e.g., Compliance). If the token is reassigned to a group or role and the configuration property bam.team.assignment.tracking.enabled is set to true, the column is updated to the group/role assigned (e.g., GROUP:Compliance). Can be overwritten by the token attribute BAM_teamId. |
| status | 'Active'|'Cancelled'|'Completed'|'Suspended' | 'None'
|
Process token status |
| elementId | string | ID of the activity inside the process/sub-process |
| elementType | 'SubWorkflow'|'ScreenTask'|'IntermediateEvent'
|
Activity type |
| elementInfo | string | Detailed information used only for intermediate events (signal name, message queue) |
| elementName | string | Name of the activity inside the process / sub-process |
| elementTaskListName | string | Tasklist name of the activity inside the process/sub-process |
| creationTime | string | Process token creation time |
| modificationTime | timestamp number | Process token modification time |
| workflowId | string | Process ID ('AccountOpening'). This is the ID of the lowest-level process if the token is on a sub-process. It may differ from workflowId in the BAM_WorkflowInstances table. |
| depth | number | Depth level in the sub-process hierarchy for the current token (e.g., 3) |
| subWorkflowId | string | If the token resides on a sub-process, this is the ID of the sub-process inside the container process. |
| swimlaneName | string | Name of the swimlane where the process token is. This is the lowest-level swimlane available, traveling up the sub-process hierarchy. |
| phaseName | string | Name of the phase where the process token is. This is the lowest-level phase available, traveling up the sub-process hierarchy. |
| parentTokenId | string | Lowest-level BAM-relevant parent token available for the current token. This may differ from the standard parent token if that one has no SLA and is not saved in the BAM DB. |
| suspendedFor | number in milliseconds | Total time during which the token was in Suspended status. |
| dueDate | timestamp number | The due date of the token as specified in the process diagram. Unlike SLA, the due date is dynamic and instance-specific. SLAs are static durations from creation; due dates can be exact timestamps (e.g., “Wednesday, March 2, 3 p.m.”). |
| activitySLA | number in minutes | SLA of the activity at creation time. This is never updated after creation. If no SLA is set, the value is 0. |
| activityExpirationTime | timestamp number | Expiration time for the activity based on SLA, calculated as creationTime + SLA. Not updated after creation. If no SLA is set, value is 0. |
| activityWarningTime | timestamp number | Warning time based on SLA and threshold, calculated as creationTime + (SLA * threshold). Not updated after creation. If no SLA is set, value is 0. |
| activityWarningTime | timestamp number | (Duplicate entry) Warning time based on SLA and threshold, computed as creationTime + (SLA * threshold). If no SLA is set, value is 0. |
Table 7: BAM_WorkflowTokens table
BAM_WorkflowTokenAttributes
The BAM_WorkflowTokenAttributes table contains one row for each BAM-relevant process token and token KPI. The primary key of the table is (workflowTokenId,workflowInstanceId,attributeName).
| Column Name | Data Type | Description |
|---|---|---|
| workflowTokenId | string | Process token ID ('12345678') |
| workflowInstanceId | string | Process instance ID ('1234321') |
| attributeName | string | Name of the process token KPI ('clientRegion') |
| attributeType | string | KPI value type ('java.lang.String') |
| attributeValue | string | Process token KPI value ('EMEA') |
| attributeEncoding | string | Encoding of the KPI value, if any |
Table 8: BAM_WorkflowTokenAttributes table
BAM_WorkflowTokenParticipants
The BAM_WorkflowTokenParticipants table contains one row for each token reassignment. For example, if two users worked on a screen task, the table contains two rows for that screen token. If the token was assigned to a first user, then assigned to a second user and finally reassigned to the first user, the table contains three rows: one for each reassignment.
The table also contains the current assignment for each active token. The primary key of the table is (workflowTokenId,userId,startTime).
| Column Name | Data Type | Description |
|---|---|---|
| workflowTokenId | string | Process token ID ('12345678') |
| workflowInstanceId | string | Process instance ID ('1234321') |
| userId | string | User ID for the reassignment ('NM', 'Peter') |
| startTime | timestamp number | Timestamp showing as of when the token was assigned to the user |
| endTime | timestamp number | Timestamp showing as of when the token was no longer assigned to the user |
Table 9: BAM_WorkflowTokenParticipants table
Functions
The FNZ Studio's BAM extension provides a set of out-of-the-box extraction and utility functions. These functions are implemented in the BAM extension using direct SQL queries and Java code; therefore their code is not available/editable from FNZ Studio Composition. This section provides a list of these functions organized in sets, with a description of each.
Utility Functions
| Function | Description |
|---|---|
| GetBAMProcesses |
Returns a list of all processes that are BAM relevant, i.e. which have at least one scenario with at least one SLA.
The result is a named collection; the keys are process IDs, and the values are process names (e.g. {'TestProcess'= 'Test Process', 'AOP'= 'Account Opening'}:String).
|
| GetProcessScenarios |
Returns a list of defined scenarios given the process ID.
The result is a named collection; the keys are scenario IDs, and the values are scenario names (e.g. {'1'= 'default', 'test'= 'Test Scenario'}:String).
|
| GetProcessScenariosComplete |
Similar to the previous function; returns all scenarios for a specified process ID, but the result contains all details of each scenario, including all SLAs defined. Used for reporting purposes.
The result is an indexed collection of named collections. Each named collection contains all data for a scenario, plus the list of activity SLAs for the scenario.
Example: [{'scenarioID'='individual', 'scenarioName'='Individual', 'SLA'='10', 'threshold'='0.75', 'activities'= []}:String]:Any.
The list of activities is another indexed collection of named collections.
Keys for the scenarios are scenarioID, scenarioName, SLA, threshold.
Keys for the activities are procId, elemId, SLA, threshold.
|
| ExportSLADefinitions |
Exports all SLA definitions to a specified text file. The default save location (unless otherwise specified) is /work/BAM/SLAexport.txt.
The content of the file is the Java serialized version of all process and activity SLA objects; therefore it is not possible to edit the file manually.
This feature is also available in the BAM Installation Module inFNZ Studio Composition. It is available as a script function for deployment automation purposes.
|
| ImportSLADefinitions | Imports all SLA definitions from a specified text file. The specified text file is the result produced by running the ExportSLADefinitions function. This feature is also available in the BAM Installation Module inFNZ Studio Composition. It is available as a script function for deployment automation purposes. |
| DeleteBAMData | Deletes all BAM data related to processes completed or cancelled before the date specified. Providing a date of 11-17-2014 would delete BAM data related to processes completed by or cancelled before 23:59:59 on 11-16-2014. Optionally, a process ID can be specified so that only data related to that specific process are deleted. This feature is also available in the BAM Installation Module in FNZ Studio Composition. It is available as a script function for deployment automation purposes. |
Table 10: Utility Functions
Process Functions
This set includes functions that can be used inside processes in order to retrieve and use BAM information for a specific process instance.
| Function | Definition |
|---|---|
| GetProcessWarningTime | Returns the warning time for the specified process instance ID as a timestamp.This is a shortcut for reading from the process instance attribute, processWarningTime. |
| GetProcessExpirationTime | Returns the expiration time for the specified process instance ID as a timestamp.This is a shortcut for reading from the process instance attribute, processExpirationTime. |
| GetActivityWarningTime | Returns the warning time for the specified process token ID as a timestamp.This is a shortcut for reading from the process token attribute, activityWarningTime. |
| GetActivityExpirationTime | Returns the expiration time for the specified process token ID as a timestamp.This is a shortcut for reading from the process token attribute, activityExpirationTime. |
| SetProcessSLAScenario |
Updates the current scenario ID for a running process instance. This function updates the process warning and expiration time in the BAM DB, and in the process attributes. The warning and expiration times of the running activities in the processes are not updated. This means that the SLA for an activity in progress never changes. The scenario change affects all activities started after the scenario change.
This function also writes the current scenario ID to a process instance attribute called `BAM_Scenario`. Optionally, the name of this attribute can be changed in the extension configuration using the property |
| GetProcessSLAScenario | Returns the current scenario id for the specified process instance id. This is a shortcut for reading from the process instance attribute “BAM_Scenario” (or what is contained in the property bam.scenario.attribute.name) |
| SetProcessInstanceKPIs | Sets one or more BAM KPIs for the specified Process Instance. The KPIs are provided as key-value pairs in the $kpis Named Collection parameter. This method is an alternative to using Trackpoints in the Process Editor. |
| SetProcessTokenKPIs | Sets one or more BAM KPIs for the Process Token identified by the specified Process Instance and Token Ids. The KPIs are provided as key-value pairs in the $kpis Named Collection parameter. This method is an alternative to using Trackpoints in the Process Editor. |
Table 11: Process Functions
Extraction Functions
The last set of functions includes the actual extraction functions that are used in the dashboards to read runtime process data. The functions use standard filtering structures as input parameters in order to standardize the way the results are filtered.
BAM provides two filtering structures: BAMFilter for process filtering and BAMActivityFilter for activity filtering. These are deployed as Data Classes by the BAM extension and can be used as inputs when invoking the extraction functions from the scripting language.
It is not possible to delete, move to another Package or refactor the id of the Data Classes BAMFilter and BAMActivityFilter.
The BAMFilter structure contains the following filtering criteria:
| Filter | Definition |
|---|---|
| processId |
Process ID to be considered (mandatory). Alternatively, this field can also contain a pipe | separated list of process IDs if it is necessary to extract data belonging to multiple processes.
|
| scenarioId | Scenario ID to be considered |
| processStatus |
Status of the processes to be considered ('Active'|'Completed'|'Cancelled'|'Suspended') (mandatory)
|
| startDateCreation | Start date of creation time (Date) |
| endDateCreation | End date of creation time (Date) |
| startDateModification | Start date of modification time (Date) |
| endDateModification | End date of modification time (Date) |
| attributes |
Named collection of process instance-level KPI names and values. For optimal query performances, four KPIs should be specified at most. If the specified attribute value contains | characters, those are interpreted as separators for multiple possible values of the attribute (turned into OR conditions in the underlying query).
|
| dateFilterType | Used for the out-of-the-box dashboards; can be left blank |
| SLAStatus | Current SLA status ('green'|'red'|'yellow'|'none') |
Table 12: BAMFilter filtering criteria
The BAMActivityFilter structure contains the following filtering criteria:
| Filter | Definition |
|---|---|
| taskId | ID of the task |
| taskName | Name of the task |
| taskListName | Tasklist name of the task |
| workflowId | ID of the sub-workflow |
| userId | User ID of the owner of the task |
| teamId | Team ID owner of the task |
| swimlaneName | Name of the swimlane the activity is in |
| activityStatus | Current status of the activity ('Active'|'Completed'|'Cancelled'|'Suspended') |
| SLAStatus | Current SLA status ('green'|'red'|'yellow'|'none') |
Table 13: BAMActivityFilter filtering criteria
Here is the set of extraction functions:
| Function | Description |
|---|---|
| CountInstancesByStatus |
Returns the amount of instances with the specified status, given the BAMFilter. The result is an integer. |
| CountInstancesBySLAStatus |
Returns the amount of instances with the specified SLA status, given the status The result is an integer. |
| CountInstancesByScenario |
Returns the amount of instances by scenario, given the BAMFilter. The result is an indexed collection of named collections. Each named collection contains a scenario, and the keys are: |
| CountInstancesByMonth |
Returns the amount of instances by month, given the BAMFilter The result is a named collection with the months as keys and the count as values, for example. {'201302'=10, ‘201303'=12}:Integer. The months are in the format This function also allows the use of a multiplier for the instance number. The multiplier is specified as the name of a process instance KPI. For example, if more than one account can be opened inside one process, and the function should count accounts and not processes, a process instance KPI called numberOfAccounts could be used as multiplier for the number of processes. |
| ComputeAverageDurationByMonth |
Returns the average instance duration by month in days, given the BAMFilter. It is also possible to specify the name of a process instance KPI to be used as multiplier (same as the function CountInstancesByMonth). The average will be weighted based on the multiplier. |
| GetInstancesOverview |
Returns details about the set of processes instances that satisfy the given BAMFilter. It is also possible to specify a BAMActivityFilter; in that case the result will contain only instances with at least one sub-activity that satisfies the given BAMActivityFilter. The last input parameter (optional) is an indexed collection with the process instance KPIs to be returned in the result. The return value is an indexed collection of named collections. Each named collection contains details about one instance. The keys are: plus the KPI names specified as input. |
| GetInstancesOverviewCount |
Same as the function |
| GetInstanceOverview |
Returns details about a specific process instance, given the process instance ID — and (optionally) an indexed collection with the process instance KPIs to be returned in the result. The result is a named collection. The keys are: plus the KPI names specified as input. |
| GetInstanceActivities |
Returns the list of activities for a specific process instance, given the process instance ID. It is possible to specify one additional parameter with the list of process token KPIs to be returned in the result. The result is an indexed collection of named collections. Each named collection contains details about one activity.The keys are: plus the token KPI names specified as input. |
| GetUserActivities |
Returns the number of red, green, yellow, no SLA ( The result is an indexed collection of named collections. Each named collection contains details for one user. The keys are: Example: [{'userId'='nm', 'status'='Active', 'total'='20', 'red'='5', 'green'='5', 'yellow'='5', 'none'='5'}:String]:Any. |
| GetActivityOverview |
Returns activity details grouped by activity, swimlane, status and SLA status. As for the other functions, the BAMFilter input defines the set of processes to be considered. The result includes the count for each group, and the average duration. The result is an indexed collection of named collections. Each named collection contains details about one activity group.The keys are: |
| GetActivities |
Returns full details about the set of activities that satisfy the given BAMFilter and BAMActivityFilter. It is possible to specify two additional parameters with the list of process instance KPIs and process token KPIs to be returned in the result.The result is an indexed collection of named collections. Each named collection contains details about one activity.The keys are:
plus the instance KPI names and the token KPI names specified as input. |
| GetActivitiesCount | Same as the function `GetActivities`, but only returns the number of activities that satisfy the given BAMFilter and BAMActivityFilter. |
| BuildBAMFilterSQL |
Returns the SQL `where` clauses built based on the given BAMFilter. The BAMFilter values found in the input object are translated to SQL conditions that can be appended to a custom query built in the scripting language. The generated SQL uses `wi` as alias for the BAM_WorkflowInstances table; therefore it is necessary to use that alias in the custom query to be built. The generated SQL contains blank spaces at the beginning and end of the string, and contains the `and` keyword at the beginning only. For example: ' and wi.workflowId = 'myProcess' |
| ComputeProcessDurations |
Returns the Average, Minimum, Maximum and Median duration [seconds] of completed instances of the specified root process. The user has the option of specifying the scenario to be considered, and the start and end date of the interval to be considered. The result is a named collection of Floats. The keys are The values are the computed instance durations in seconds |
| ComputeActivityDurations |
|Returns the Average, Minimum, Maximum and Median duration [seconds] of completed activities of the specified task in the specified process. The user has the option of specifying the scenario to be considered and the start and end date of the interval to be considered. The result is a named collection of Floats.The keys are The values are the computed activity durations in seconds. |
| GetMaxModificationTimestamp |
Returns the maximum modification timestamp of completed instances of the specified root process. The user has the option of specifying the scenario to be considered. The result is a Date. |
| GetMinModificationTimestamp |
Returns the minimum modification timestamp of completed instances of the specified root process. The user has the option of specifying the scenario to be considered. The result is a Date. |
| CountInstancesByDurationIntervals |
Counts process instances whose duration falls in the specified intervals and that satisfy the given BAMFilter. This functions is used to create the duration distribution chart. The user has the option of specifying the unit of measurement of the durations (`D`: day, `h`: hour, `m`: minute); the interval length to be used to group instance durations (e.g. `3D` = 3 days, default is the standard deviation); and the number of intervals to return (must be a even number, default is 6). The average is always used as the center of the distribution (as in the normal distribution). Negative intervals are discarded. The result is an indexed collection that contains the following elements, in order of appearance:
Each entry of the named collection has, as a key, the concatenation of the extremes of the interval separated by a comma (e.g. '3.2,4.5') and as a value, the count of instances whose duration falls in the given interval. |
| GenerateScatterPlotData |
Returns data to be used to generate a scatter plot that displays how instance duration depends upon the variation of the value of the specified KPI, given the BAMFilter. The user has the option of specifying the unit of measurement of the durations ( The result is an Indexed Collection that contains as a first element the measurement unit (D|h|m), and as a second element another indexed collection with the set of values for the chart.Within the indexed collection of the second element, each chart value corresponds to one process instance and is returned as a named collection whose keys are |
| CountNextOverdueActivities |
Returns the number of activities belonging to the given top-level process (that is, the topmost process in the hierarchy of processes and sub-processes) that will become overdue within the given timespan (in minutes). It is possible to also specify subworkflow IDs and element IDs in order to limit the counting to a given activity in the process. It is also possible to specify the userId to limit the counting to activities assigned to a specific user.The result is an integer. |
| CountUserCompletedActivities |
Returns the number of activities belonging to the given top process that were completed between the given start date and the given end date. It is possible to also specify subworkflow IDs and element IDs in order to limit the counting to a given activity in the process. It is also possible to specify the userId to limit the counting to activities assigned to a specific user. The result is an integer. |
| GetTokenParticipants |
Returns the list of participants of the specified token, given the token ID. The result is an indexed collection of named collections. Each named collection contains details about one reassignment. The keys are: |
Table 14: Extraction Functions
Studio Modules
After the BAM extension has been installed and Appway restarted, a new studio sub-module appears under Solution Maintenance. The new sub-module is called BAM and contains three items:
- Measure & Analyze: The tool that lets the user configure measuring options, scenarios and SLAs for all processes and their activities
- BAM Dashboard: Displays the committed version of the BAM Dashboard process
- SLA Report: Displays the out-of-the-box report of all scenarios and SLAs defined in the environment
This chapter provides more detail on each of these items.
Note: If the Permissions functionality is licensed, only users with the permission BAMAdministrator have access to the BAM sub-module. If the permissions functionality is not licensed, all users with Studio access can access the BAM sub-module.
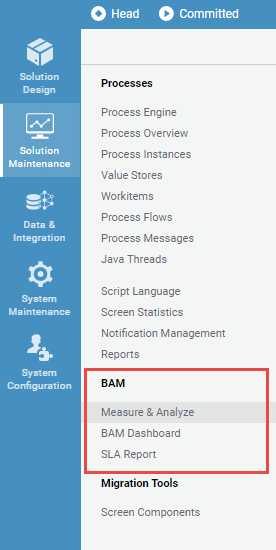
BAM modules inside the Appway Studio
Measure & Analyze
This module allows the user to specify which processes and activities are measured by BAM, and to define scenarios and SLAs for Appway processes. Only activities and processes which have the "measure" flag set will be saved in BAM and then made available in the dashboards. No processes are tracked in BAM by default.
Deciding which processes and activities should be measured is a fundamental step in the setup of BAM. Setting SLAs and defining scenarios, however, is optional: If no SLA is defined for a process but the process has the measure flag enabled, the SLA value is set to 0. The process is still measured (and therefore recorded in the database).
The Measure & Analyze tool assists the user in analyzing the available measurement data in order to set meaningful SLAs on the processes and activities by providing aggregated duration indicators (median, average, minimum, maximum).
Overview of Processes
The first screen of the Measure & Analyze tool contains a list of all the processes that can be tracked by the BAM extension. This list includes all processes defined in the library that have at least one swimlane. This means that processes without swimlanes, which are temporary processes not persisted beyond the user session, cannot currently be tracked with BAM.
Processes in the list are displayed with one of two icons depending on whether they have at least one measurement option defined on them or none. This is shown in the figure below.
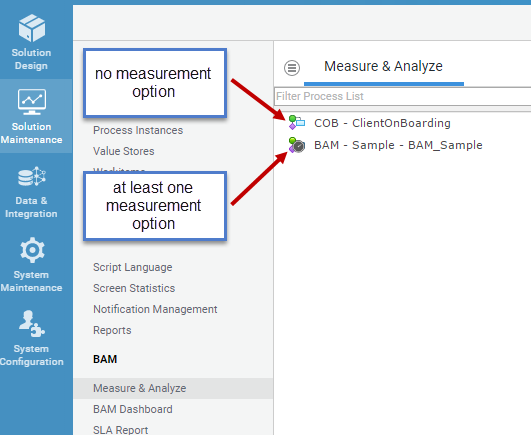
Difference between processes with and without measurement options in the Measure & Analyze tool
With a single click on a process in the list, the standard right bar is shown. The bar shows details about the process, including ID/name, file attachments, dependencies and a change log. It is also possible to start the process in the workspace. This right-hand bar is the same as that found in the Studio library.
Upon right-clicking on a process in the list, a pop-out menu command appears which allows the user to delete all measurement options from the selected process. If this action is performed, the process data will no longer appear in the dashboards.
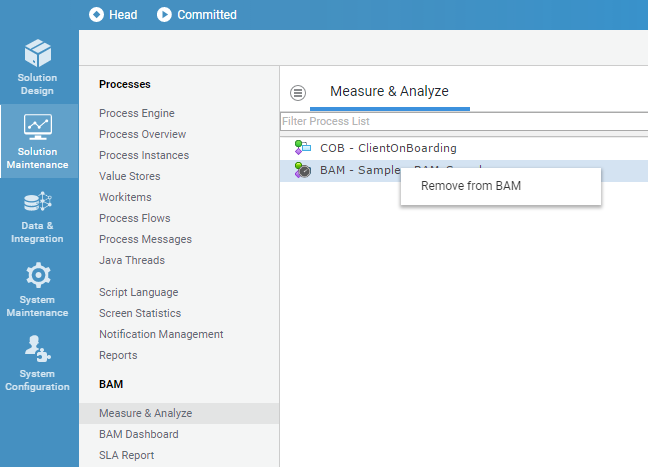
Delete all measurement options on a process from the Measure & Analyze tool
Measure & Analyze tool
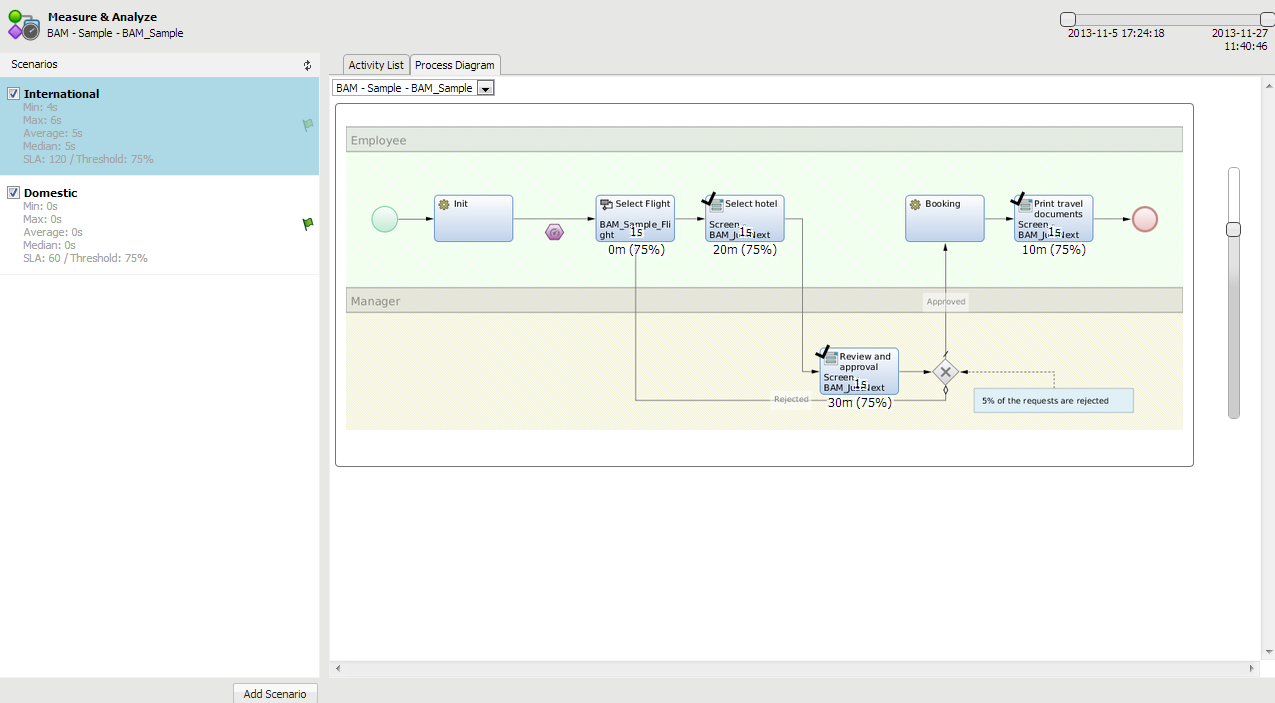
With a double click on a process, the actual Measure & Analyze editor for the selected process opens in a new window. The editor is organized into a left sidebar used to configure scenarios, and a content area used to perform activity-level configuration. A time slider at the top right of the window allows users to restrict the time interval for the computation of the aggregated values (min/max/avg/median) for all scenarios and activities.
All views are based on the head version of the selected process.
Main page of the Measure & Analyze tool showing scenario and activity level configuration
Scenarios
The scenario area in the left sidebar lists all scenarios defined for the selected process, including their SLA and threshold. For each scenario, a checkbox shows if the scenario is currently being measured by BAM. The overview also shows the minimum, maximum, average and median duration of the instances in the scenario. The SLA value of a scenario indicates the overall expected duration of the process.
By right-clicking on a scenario and selecting the Edit Scenario option, the user can:
- Edit the scenario name
- Set the "measure flag"
- Review the minimum, maximum, average and median duration of the instances in the Measure tab
The Analyze tab in the dialog window allows the user to set the SLA (days, hours and minutes) and threshold. The warning time is automatically computed (as SLA*threshold) and displayed.
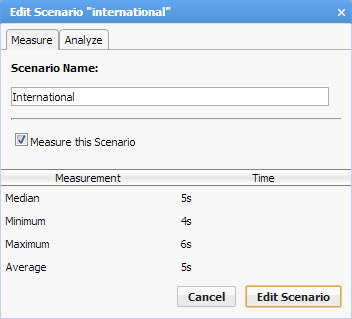
Edit Scenario dialog - Measure
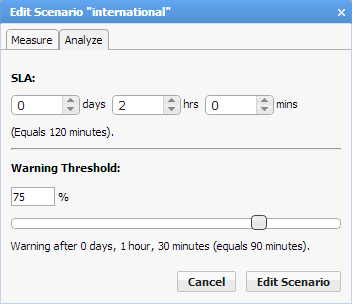
Edit Scenario dialog - Analyze
Two additional actions are available on click of a scenario:
- Duplicate scenario copies a scenario and all the settings on its activities.
- Delete Scenario removes the scenario from the DB. Once the scenario is deleted, all the instances running in that scenario are no longer visible in the dashboards.
The small green flag for each scenario indicates the default scenario. Users can switch from one default scenario to another by clicking on the flag of the desired default scenario. Each process instance where no scenario was set is measured using the default scenario.
The Add Scenario button at the bottom of the sidebar lets the user create a new scenario by specifying its ID and name. The SLA and threshold can be specified if desired. The "measure" flag is set to true by default for a new scenario.
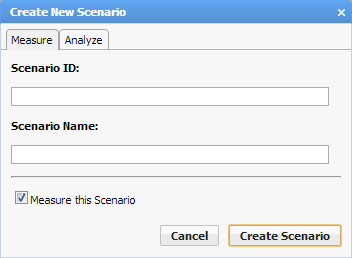
Scenario creation dialog
For each process, a default scenario is automatically created by the BAM extension. The name of the scenario is default and the ID is 1. If there is no need to specify different scenarios for a process, the default scenario can be used to set all SLAs and measurement options. All processes will always be started under the default scenario if no other scenario is available.
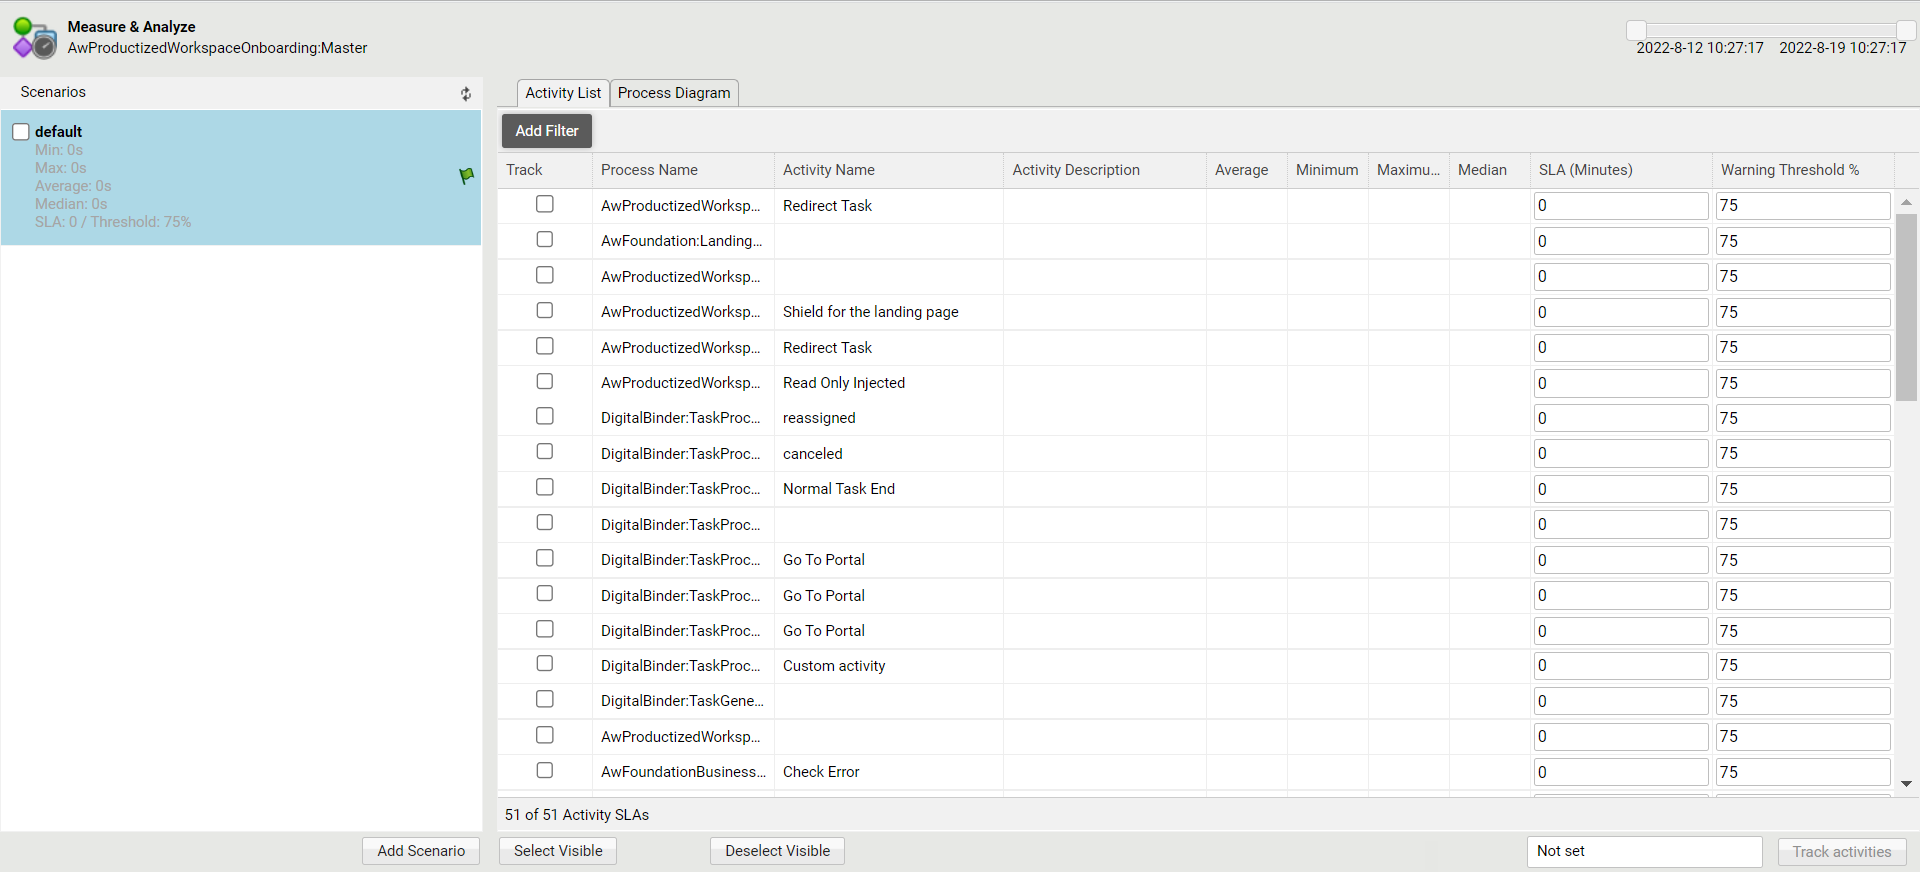
Activity List Tab
The first tab on the activity configuration is Activity List, which provides quick entry of measurement options, SLAs and thresholds from a sortable and filterable table.
The Activity List tab displays all sub-activities and sub-processes of the previously selected root process in a flat list. The first column shows the "measure" flags for all the activities (which determines whether the activity is saved in the BAM DB or not). Let's analyze its main features:
- The Select Visible and Deselect Visible buttons at the bottom of the page allow the user to easily check/uncheck these flags for all visible activities.
- The selector at the bottom right of the page (default value: Not Set) allows adding additional Sub-Processes to be tracked as part of the selected root Process. This is useful when the root Process uses dynamically injected Sub-Processes (included in the Process using a Sub-Process task with a dynamic expression in the Process field), which are not listed in the table by default.
- On the table, the Process Name column indicates the name of the sub-process where the activity is located. It is possible to work on a specific sub-process by selecting the sub-process name in the second column.
- The remaining columns show the activity name and description, and the minimum, maximum, average and median duration of the activities. All columns are sortable and filterable.
- The SLA (Minutes) and Warning Threshold (%) columns can be edited directly on the table. Consider that an activity SLA equal to
0is equivalent to no SLA set on the activity.
Process Diagram Tab
The Process Diagram tab provides a more graphical interface. It displays an image of the selected process, with the SLAs and thresholds noted below each activity. Overlayed on each activity are a check sign indicating the measure flag (if set), and the average duration of the activity. By right-clicking on the image, users can open the process in the process editor.
Users can also set the measure flag, and edit the SLA and threshold of an activity by simply clicking the activity in the image. This will open an edit pop-up with two tabs, Measure and Analyze — the same two tabs as mentioned above for the scenario.
If the process contains sub-processes, users can drill down into a sub-process by right-clicking on it and selecting Jump to this Sub-Process. This opens the sub-process image, allowing the user to enter SLAs and thresholds for all activities in the sub-process. This drilling down can be repeated recursively for any nesting level. The desired sub-process can also be selected from the dropdown list at the top of the Process Diagram tab.
Please note that while it is possible to edit the SLA and threshold for all processes and activities at any time, the change will only be applied to the new process instances and activities started after the change. In other words, a change to an SLA value is not reflected in process instances that were already running when the change was applied.
Please note that when a process is moved from one package to another or when its id is refactored, the measurement options on the process (SLAs, scenarios, measure flags) are not carried over and must be re-entered.
Process Diagram editor with process drill-down feature
BAM Dashboard
This module provides access to the BAM Dashboards process. The content of this section is the same as that generated when starting the committed version of the process in the workspace. By default, the process ID is BAM_Dashboards, the ID of the process in the out-of-the-box solution. This can be changed using the property, bam.dashboard.process.
BAM Dashboards displayed inside the Appway Studio
SLA Report
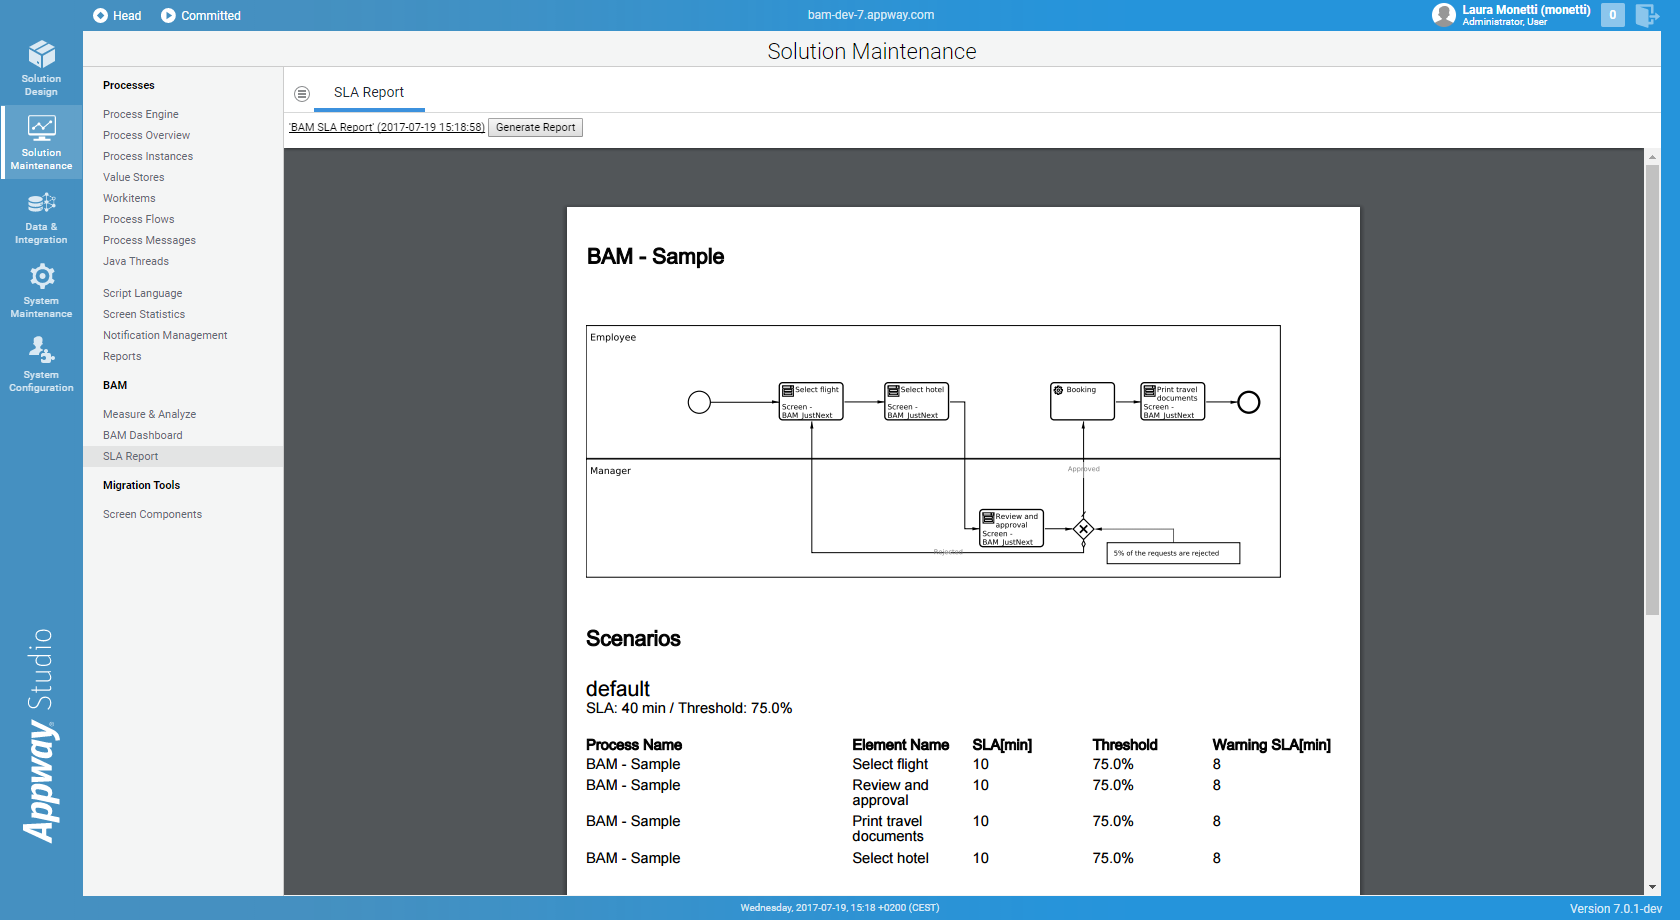
This module displays a PDF report of all the SLAs that have been defined in the environment in use. The PDF Report is generated using the standard Appway Report functionality and is therefore defined as an Appway object, allowing full customization.
The configuration property bam.slareport.report allows the user to select other reports to be displayed in this module. The value of this property should be the ID of a valid Report object in the Appway library.
In the out-of-the-box solution, the report is called BAM_SLAReport and is built with a dynamic document (PDF Output + PDF Output Table). It generates a PDF file with the list of processes for which at least one measurement option is defined, and includes the list of scenarios and activity SLAs for each process.
The details provided for each process include the image of the process analyzed and one SLA table per scenario, with the corresponding SLA and threshold.
The SLA table contains a list of activities measured by the BAM extension:
- The process name for the activity
- The element name for the activity
- The SLA in minutes
- The threshold as a percentage
- The calculated Warning SLA in minutes (Warning SLA = SLA * threshold%/100).
The PDF contains the information that can be accessed and configured by the user in the Measure & Analyze tool. The PDF can be downloaded and saved to the local drive for reporting purposes.
The data is retrieved using the function GetProcessScenariosComplete.
BAM PDF SLA report inside the Appway Studio
Additional Components
Inbox SLA Status
The end users of Appway applications usually want to check the status of the tasks assigned to them so they know if any activity is expired or close to expiration according to the SLAs.
The SLA status of tasks on users’ task lists (or worklists) can be made visible on the application’s landing page, the portal. For each task, displaying the SLA status of the activity as well as the SLA status of the overall process instance is to be recommended. These two columns will appear with "traffic light icons" in the task list, as shown below.
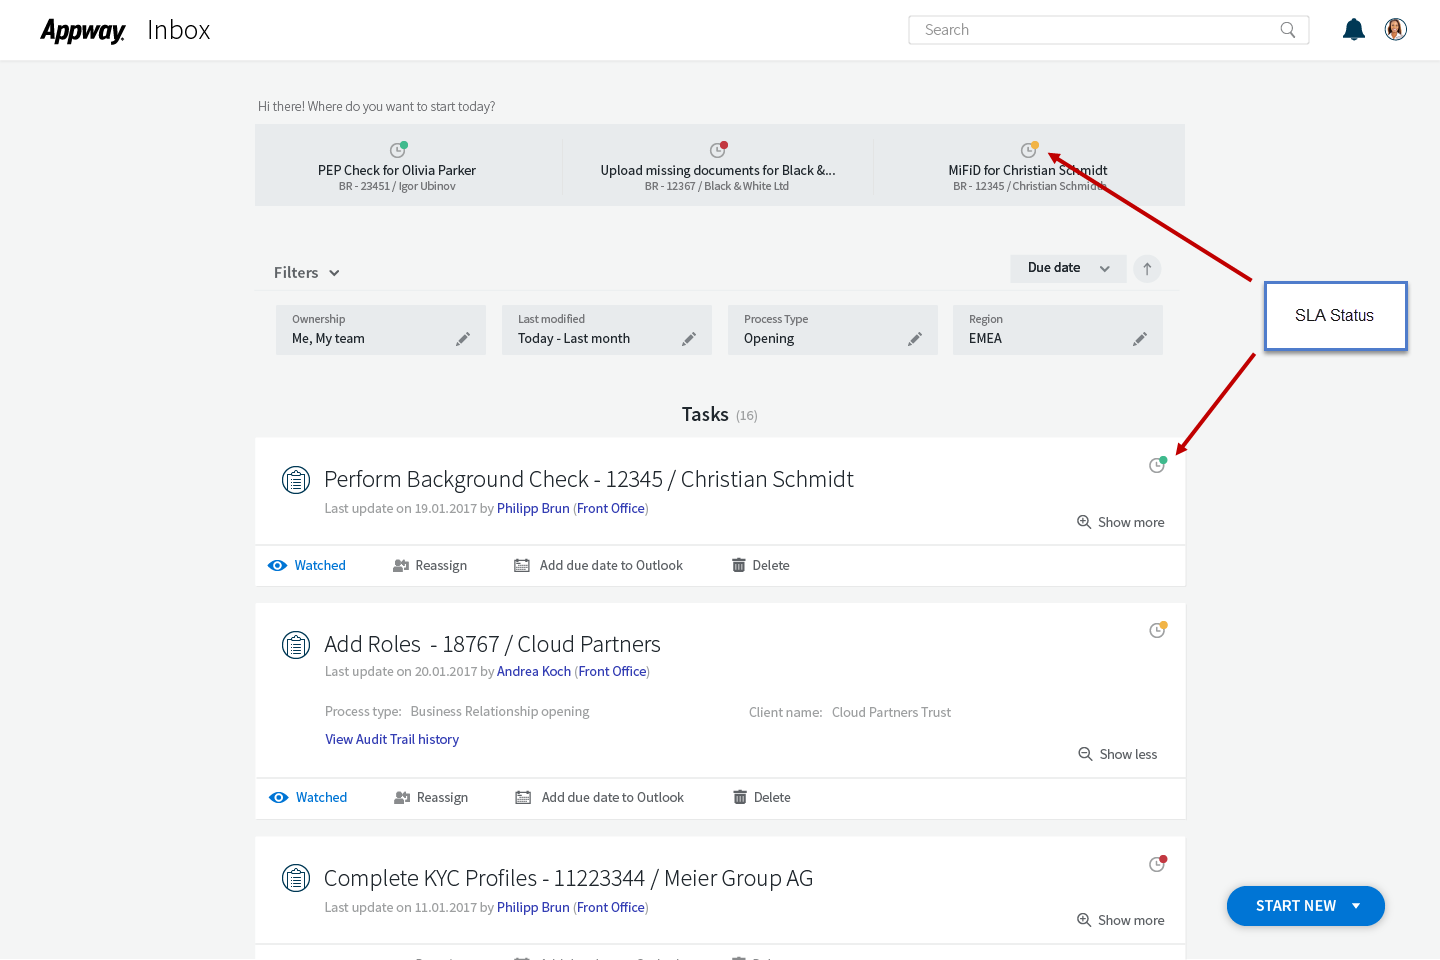
BAM traffic-light icons displayed in the Appway Inbox
In order to display the SLA icon, set the “slaVisible” property to true in the Settings – General Settings Catalog. You can find more details about this configuration in the Inbox documentation:
The behavior of the SLA icon is as follows: the Inbox will first try to use the activity warning and expiration time from the task. If those are null or equal to 0, it will try to use the process warning and expiration time. If those are also null or equal to 0, no SLA icon will be shown for the task. Otherwise, the Inbox will generate a “traffic light” icon based on the following rules:
- Red icon: If the current timestamp is higher than the expiration time, the Inbox will show a red icon.
- Green icon: If the current timestamp is lower than the warning time, the Inbox will show a green icon.
- Yellow icon: In other cases, the Inbox will generate a yellow icon. The yellow icon means that the task is not yet expired, but the threshold has been exceeded. The task is therefore in “warning” status.
Process Progress Indicator
There are many scenarios where it can be useful to see how far along a process the user currently is. But since processes can take vastly different amounts of time, depending on which choices the user makes along the process, it’s often not easy to guess how long a process is going to take.
Fortunately, Appway’s Business Activity Monitoring has a pretty good idea about this: Based on historic data, BAM can estimate how long any given process is going to take to finish. Implementing this feature is done via the Process Progress Indicator Screen component.
If you add the Process Progress Indicator Screen component to a Screen shown in a process, the component estimates how long a process is going to take based on historic data. The component then tells the user how much longer it thinks that the user will take to finish the process.
Please be aware that this information is not precise. If Appway notices that the user goes over the estimated amount of time, it skips to using the maximum time it thinks the user might take to finish a Process, and uses that as a baseline for estimating the user’s progress.
To use the Process Progress Indicator, open your process template in the Screen editor, and drag the Process Progress Indicator component into the Screen. If your process template has a Flow Bar component, we recommend dragging the Process Progress Indicator component into that Flow Bar component.
If you click on the Process Progress Indicator component, you can set its properties.
- Track Progress For allows you to change whether you want to show the user’s progress inside the root process, i.e. the topmost process in the hierarchy of processes and sub-processes, or inside the current process’s parent process. Which to choose depends on the design of your Process. If one user finishes the whole process in one go, including all sub-processes, it’s best to pick "root Process".
- Show Percentage shows an estimate for how far along the user is, in percent, If the user is about halfway through the typical time spent in the process, the percentage will show
50%, for example. - Show Progress Bar shows the same information as Show Percentage, but as a progress bar below the rendered component.
- Show Minutes shows the same information as Show Percentage and Show Percentage, but in terms of time. If a process typically takes 30 minutes to finish, and the user has spent 20 minutes on the process already, the Process Progress Indicator will estimate that it is going to take the user another 10 minutes to finish the process.
Out-of-the-Box Dashboards
The out-of-the-box dashboards are implemented using standard Appway Business Objects.
All dashboard screens are implemented using Labels in order to support internationalization. Dashboard languages currently available:
- English
- German
- French
- Italian
Prerequisites
Certain prerequisites must be satisfied for the out-of-the-box dashboards to function correctly. The following extensions must be installed (use versions compatible with your Appway version):
- Charting extension
- WorkflowImage extension
- Component extension
- DefaultIcons extension
- POI extension
The POI extension should be configured as below.
```
template.activities.resource.id = BAM_ActivitiesReport
template.activities.start.x = A
template.activities.start.y = 5
template.instances.resource.id = BAM_InstancesReport
template.instances.start.x = A
template.instances.start.y = 5
```
Installation
The out-of-the-box dashboards are shipped inside the BAM extension as an .awexport content package. This package can be imported from the System Configuration > BAM Installation page in Appway Studio by clicking on the Install Dashboards button. The standard import interface opens, letting the user check the result of the import.
The Install Dashboards button is used for the initial installation of the out-of-the-box dashboards: It imports all content, including the dashboard templates and the default settings. All imported objects should be committed immediately. This may be done automatically during the import or manually once the import is finished.
After initial installation, any further use of the Install Dashboards button will result in dashboards being reset to the default, overwriting all customization. The conflicts with local changes will be marked in the import dialog. All BAM Dashboards objects are imported in the Base Package.
Upgrade
When a new compatible version of the BAM extension is installed, the dashboards can be updated to take advantage of new features included in the version. Use the Update Dashboards button in the System Configuration > BAM Installation page to import the dashboard templates only. This will also open the standard import interface so users can check the result of the import and resolve any conflicts. Appway will not highlight any conflict during the import procedure for the following:
- No Customization – If no customization was performed on the out-of-the-box dashboard objects, the import will merely upgrade the dashboards.
- Customization according to Appway dashboard customization guidelines (see the Dashboard Customization section) – If dashboards were customized in line with Appway guidelines, the upgrade installs the new features while still preserving any customization.
However, if dashboards have been customized in a manner non-compliant with the guidelines, there is no guarantee that such customization will be kept following the upgrade. Conflicts may arise during the import procedure. These conflicts must be analyzed and resolved case by case in order to retain the desired functionalities. If the conflicts are ignored, there is no guarantee that the customizations will be retained and the dashboards will function after the import.
Structure
The out-of-the-box dashboard screens are divided into two parts:
- A filter area — Located at the top of the screen, the filter area is where the user can specify a set of filtering criteria. It includes saved filters, main filter criteria and KPI filter criteria
- A data area showing BAM data filtered according to the criteria selected; this section is organized in tabs.
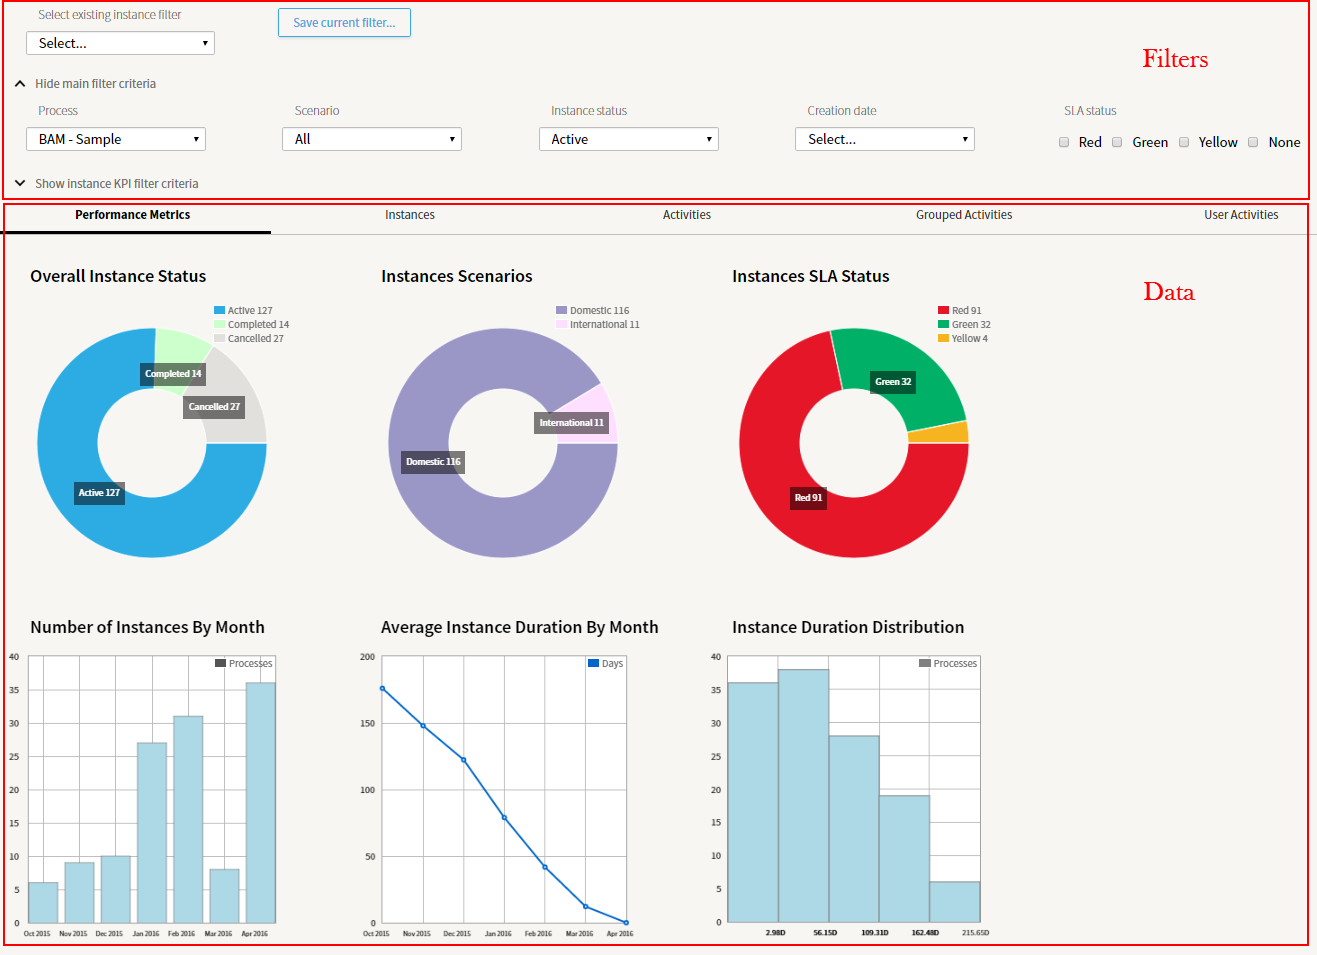
BAM Dashboards: filters and data areas
Filters
Saved Filters
The user can access a set of saved filters through the Select existing instance filter dropdown list located on top of the filtering section. The dropdown contains only the filters which refer to a process that the current user is entitled to. When a filter is selected from the dropdown, it is immediately applied to the data in the lower section of the screen.
Once a filter is selected, it is possible to access a set of actions by clicking the Show Filter Actions button. Actions include deleting the current filter, or making it available to a selected role or group. If the availability option is selected, all users in the selected group or role find the saved filter in their Select existing instance filter dropdown list (if they are entitled to the process).
The Save current filter… button lets users name and save the current filter criteria (including KPI filters). The saved filter is then available in the Select existing instance filter dropdown list.

BAM Dashboards: filtering panel and saving a filter
Main Filter Criteria
This filter area contains a set of filter criteria corresponding to the BAMFilter object described in the Functions section. This area can be closed by clicking on the Hide main filter criteria button. If the area is closed, open it using the Show main instance filter criteria button.
The table below contains a list of the filtering parameters in this area.
| Parameter | Description |
|---|---|
| Process | Name of the process to be monitored. The selection of a process is mandatory: It is not possible to browse data coming from different processes at the same time. The selection list includes all processes with at least one SLA defined on them. If needed, it is possible to define entitlements on the process list so that only specific users/roles/groups have access to the BAM data related to a certain process. To define entitlements, edit the catalog The process dropdown contains the list of processes that either do not have an entry in the |
| Scenario | Name of the SLA scenarionIt is possible to select All to browse data executed under all scenarios. The list includes all scenarios that have been defined in the Measure & Analyze tool for the selected process. |
| Instance status | Status to take into account ('Active'|'Completed'|'Cancelled'|’Suspended’)nThe selection of a status is mandatory: It is not possible to browse data coming from processes with different statuses at the same time. |
| Creation date | Date when the process was started (only if the Active status is selected)nA set of predefined ranges is available (this week, last week, this month etc.) but it is also possible to specify a custom range by selecting a start and end date. |
| End date | Date when the process was completed or cancelled (only if the Completed or Cancelled status is selected)nA set of predefined ranges is available (this week, last week, this month etc.) but it is also possible to specify a custom range by selecting a start and end date. |
| SLA status | SLA status of the process instance (Red, Green, Yellow; or None, meaning no SLA set). More than one SLA status can be selected at the same time. |
Table 16 : Dashboard Filtering Parameters
The data in the data area of the dashboards is immediately filtered upon each change of the filtering criteria.
KPI Filter Criteria
The Show Instance KPI filter criteria button allows users to specify additional filtering criteria based on defined KPIs (or custom business indicators). Once clicked, the KPI filters area appears. If the KPI filters area is already open, the Hide KPI filter criteria button closes it. It is possible to add one or more KPI filters by specifying the name of the indicator, and the value to be used for filtering.
The list of KPI names available is configured in a dedicated catalog for each process, as described in the KPI Configuration section. The value is specified using a text field if the KPI contains a string or number, or using a time range if the KPI contains a date or time. If the KPI is bound to a set of values contained in a catalog, a dropdown menu or a checkbox list is used to select the KPI value. In case of text field input, it is possible to specify the filter value using LIKE expressions: similarly to SQL, it is possible to use the wildcard % to replace a set of characters in the search string and the wildcard _ to replace a single character. For example, the filter value La% will return all items that start with La.
Up to four filtering KPIs can be specified. The KPI names and values are compared to the process instance KPIs saved in the BAM database. Only the instances that contain KPI values matching the filters are returned in the results. The data in the data area of the dashboards is immediately filtered upon each change of the KPI filtering criteria.
Data Dashboards
Five dashboards are provided in the out-of-the-box solution:
- Performance Metrics
- Instances
- Activities
- Grouped Activities
- User Activities
- Team Activities
Each dashboard is contained in a tab inside the data area of the dashboards. Navigate from one dashboard to another by simply switching tab.
The filter criteria selected in the filter area apply to all dashboards and are preserved when switching from one tab to another.
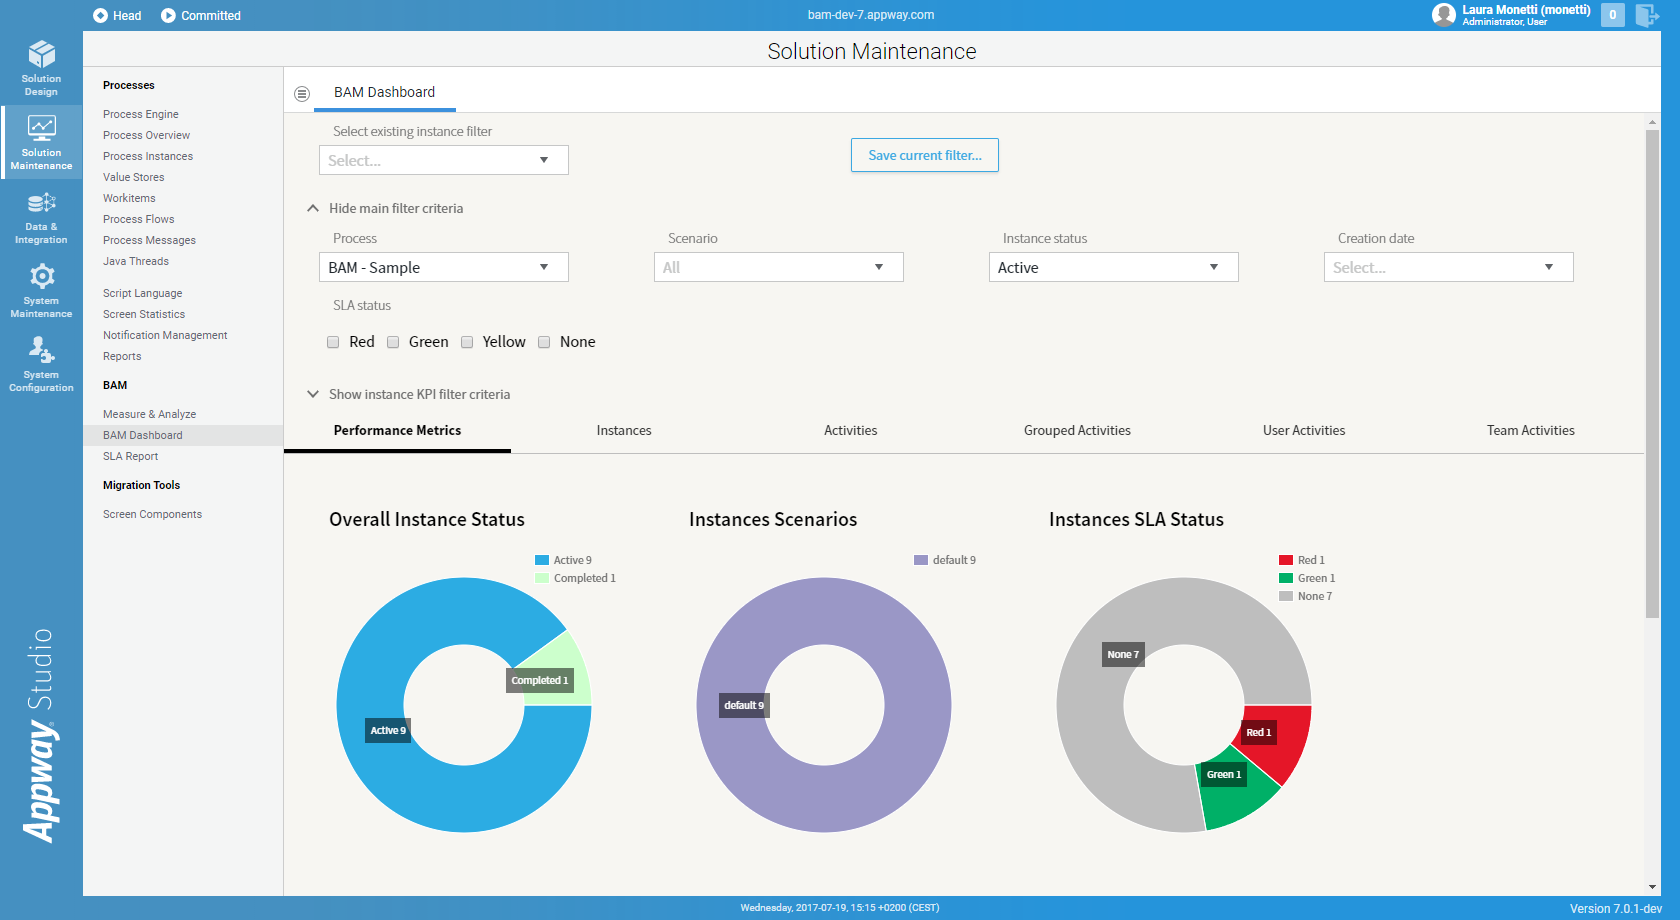
Performance Metrics
The Performance Metrics dashboard is an overview of the process instances of the selected process. It displays the following monitoring charts:
| Chart | Description |
|---|---|
| Overall Instance Status | This pie chart displays the amount of instances according to their status The chart is clickable: When clicking on a status section, the filter on top is automatically updated to the selected status and all the data in the dashboard are filtered accordingly. The user is automatically brought to the Instances dashboard to drill down on the data. The data is retrieved using the function CountInstancesByStatus. |
| Instance Scenarios | This pie chart displays the amount of instances in the selected status according to the corresponding scenario. The chart is clickable: When clicking on a scenario section, the filter on top is automatically updated to the selected scenario and all the data in the dashboard are filtered accordingly. The user is automatically brought to the Instances dashboard to drill down on the data. The data is retrieved using the function CountInstancesByScenario. |
| Instances SLA Status | This pie chart displays the amount of instances in the selected process status currently in each SLA status The chart is clickable: When clicking on a SLA status section, the filter on top is automatically updated to the selected SLA status and all the data in the dashboard are filtered accordingly. The user is automatically brought to the Instances dashboard to drill down on the data. The data is retrieved using the function CountInstancesBySLAStatus. |
| Number of Instances by Month | This bar chart displays the amount of instances in the selected status, counted by month. If the selected status filter is The data is retrieved using the function CountInstancesByMonth. |
| Average Instance Duration by Month | This line chart displays the average monthly duration in days of process instances that are in the selected status. If the instances are still active, it computes the duration until the current time; otherwise, using the total duration. The data is retrieved using the function ComputeAverageDurationByMonth. |
| Instance Duration Distribution | This bar chart displays the distribution of the instances' duration among duration intervals around the duration average value. A set of duration intervals centered around the instance duration average is computed. Each interval is as wide as the standard deviation of the duration data set. The amount of instances falling in each interval is computed and displayed in the chart. The interval length and the number of intervals can be customized. The data is retrieved using the function CountInstancesByDurationIntervals. |
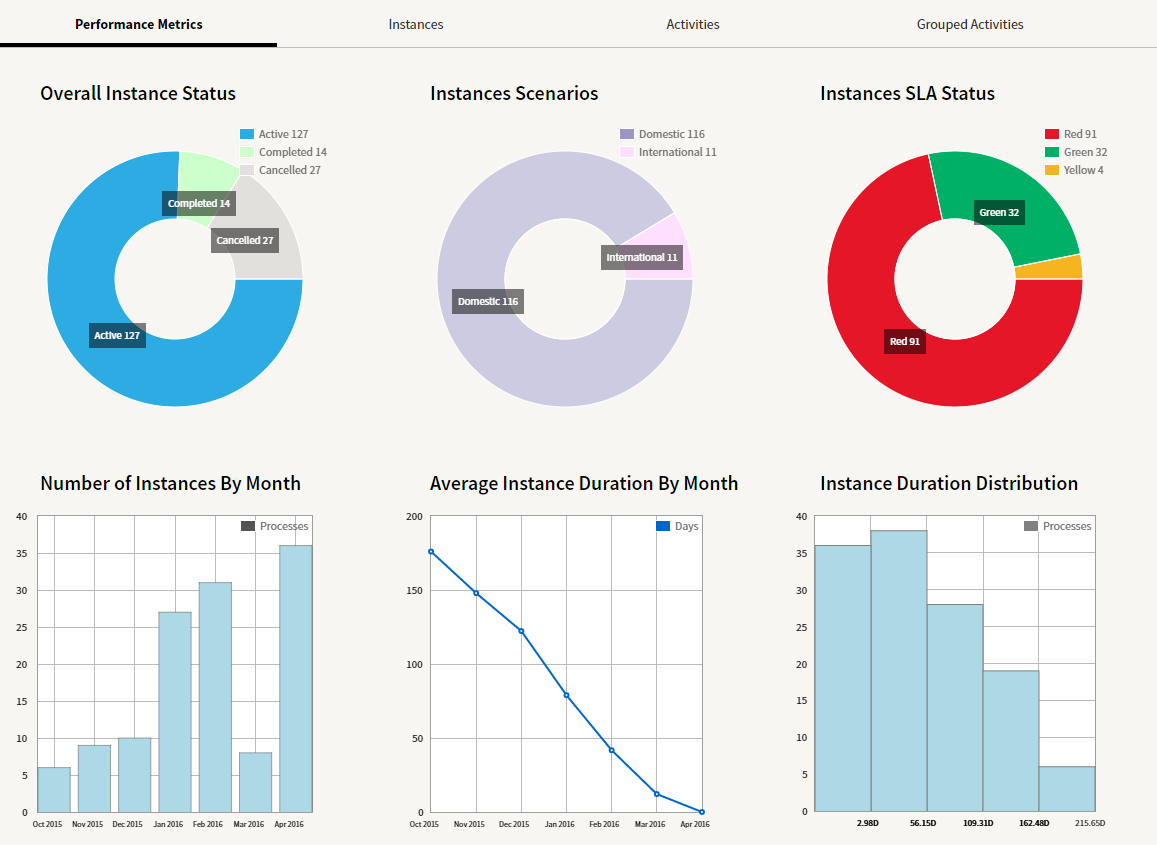
BAM Dashboards: Performance Metrics dashboard
Instances
The Instances dashboard displays a list of process instances filtered according to the criteria selected. Each row in the table represents one instance, and shows the following basic information:
- Process ID (RequestId)
- Scenario name
- Instance start date and start time
- Expiration time
- SLA status
If no SLA has been set for the process, the expiration time is not shown and the SLA status is marked in grey. Additionally, an arbitrary number of process-specific KPIs can be shown in corresponding columns.
The list of KPIs to be included is configured in a dedicated catalog for each process, as described in the KPI Configuration section. The table provides sorting and filtering capabilities for each column. The data is retrieved using the function GetInstancesOverview.
The Instances dashboard has a limit on the maximum amount of instances that can be displayed, in order to avoid performance issues. The default value is 500, but this can be edited by setting the Appway configuration property bam.instances.max.results. The number of instances is computed using the function GetInstancesOverviewCount.
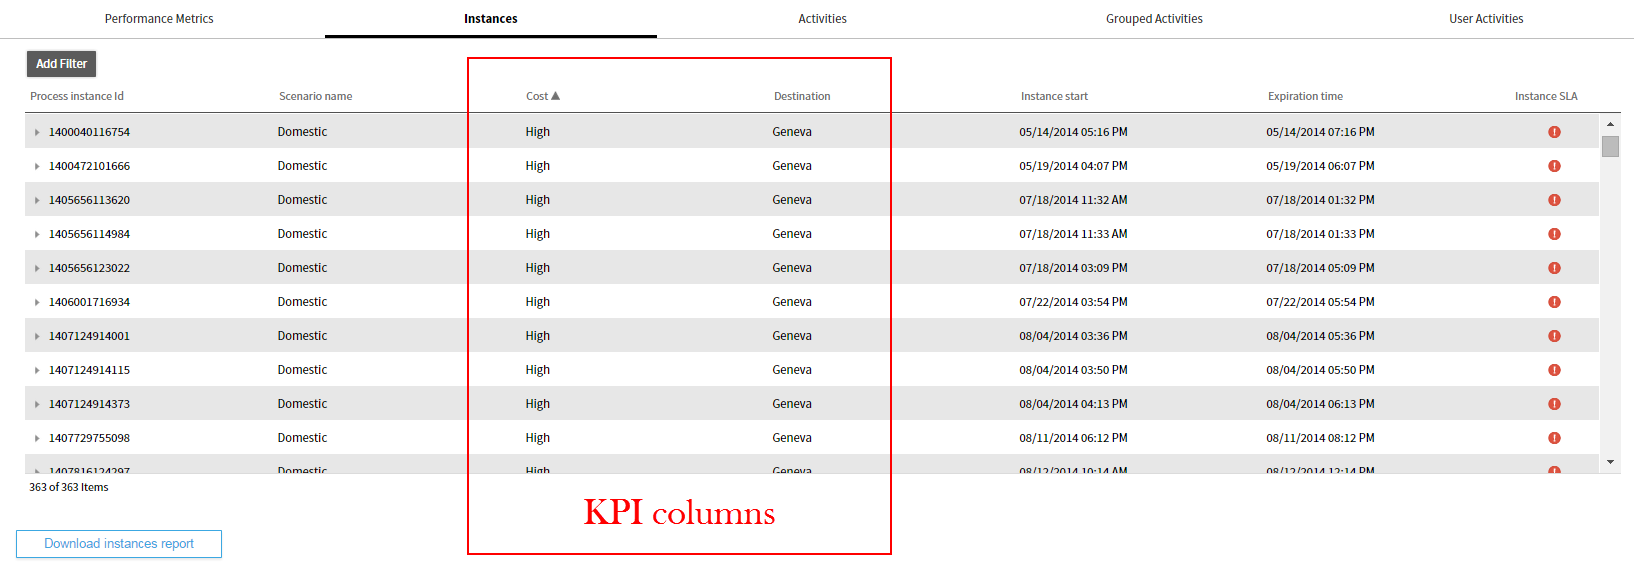
BAM Dashboards: Instances dashboard
Users can open a process instance interline by clicking on the small arrow to the left of the Process instance ID to drill down into details about the specific process instance. As shown in the figure below, the details provided on top of the interline include a list of the instance’s standard and custom properties. Standard properties:
- Process
- Scenario name
- Status
- Creation date
- Last modification date
In addition, a list of KPIs can be included. This list is configured for each process in a dedicated catalog, as described in the KPI Configuration section. The data is retrieved using the function GetInstanceOverview.
Below the properties list, a table provides a list of all activities that have been performed or are being performed for the selected instance. Included for each activity are:
- Name
- Role
- Status
- SLA status
- Expiration time
- Due date (in red if already overdue)
- Team
- Owner
- Start time
- End time (if completed)
The name column contains the element name of the activity in the process by default. To display the element tasklist name instead of the element name, create an Appway configuration property with name bam.show.taskListName, and set it to true.
In addition, the table shows a set of activity-level KPIs in dedicated columns. The list of activity-level KPIs to be included is configured for each process in a dedicated catalog, as described in the KPI Configuration section. The activities are indented based on how they are nested inside sub-processes of the main process. The data in this area are retrieved using the function GetInstanceActivities.
If an activity has been reassigned one or more times, the table includes one additional row for each reassignment. The row shows the owner (user or team), the start time of the assignment and the end time of the assignment (if completed/ further reassigned). This gives an insight into the list of people and teams who worked on the task and how the total time spent on the task was distributed among these participants.
The interline can also be detached and opened in another browser window. To do this, click the icon on the top-left of the interline, directly above the words, "Instance Summary". Once the window is detached it becomes possible to search for other process instances using the search field.
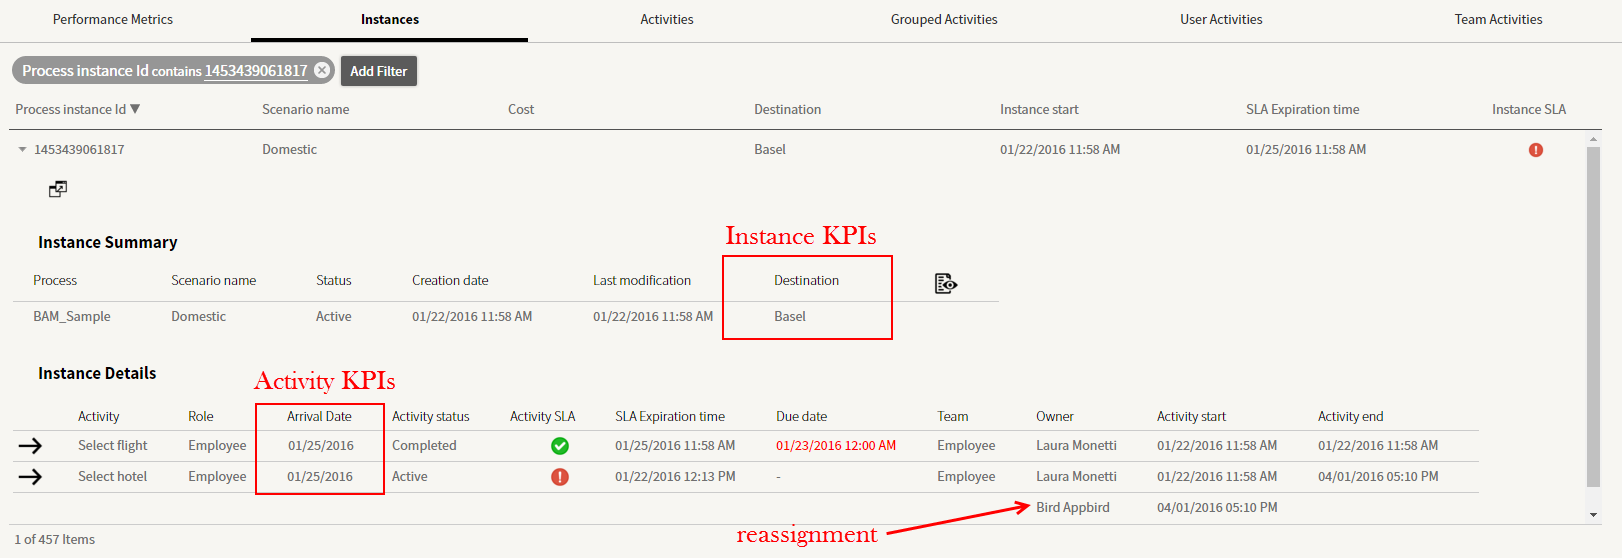
BAM Dashboards: process instance drill down
Activities
The Activities dashboard displays a list of activities belonging to instances that are filtered according to the selected criteria. Each row in the table presents one activity (token) and shows basic information, plus any custom instance-level and activity-level KPIs. For each activity, the table displays:
- Process instance ID
- Instance SLA status
- Activity name
- Activity role
- Activity status
- Owner
- Expiration time
- SLA status
- Due date (in red if already overdue)
- Activity start date and time
- Activity end date and time
The activity name column contains the element name of the activity in the process by default. To display the element tasklist name instead of the element name, create an Appway configuration property with the name bam.show.taskListName and set it to true.
If no SLA has been set for the activity, the expiration time is not shown and the SLA status is marked in grey. Additionally, an arbitrary number of custom process instance-level and activity-level KPIs can be shown in corresponding columns, as shown in the figure below.
The list of KPIs to be included is configured in a dedicated catalog for each process, as described in the KPI Configuration section. The table provides sorting and filtering capabilities for each column. The data is retrieved using the function GetActivities.
The table has a limit on the maximum amount of activities that can be displayed, in order to avoid performance issues. The default value is 1000.This default value can be edited by adjusting the Appway configuration property bam.activities.max.results. The number of activities is computed using the function GetActivitiesCount.
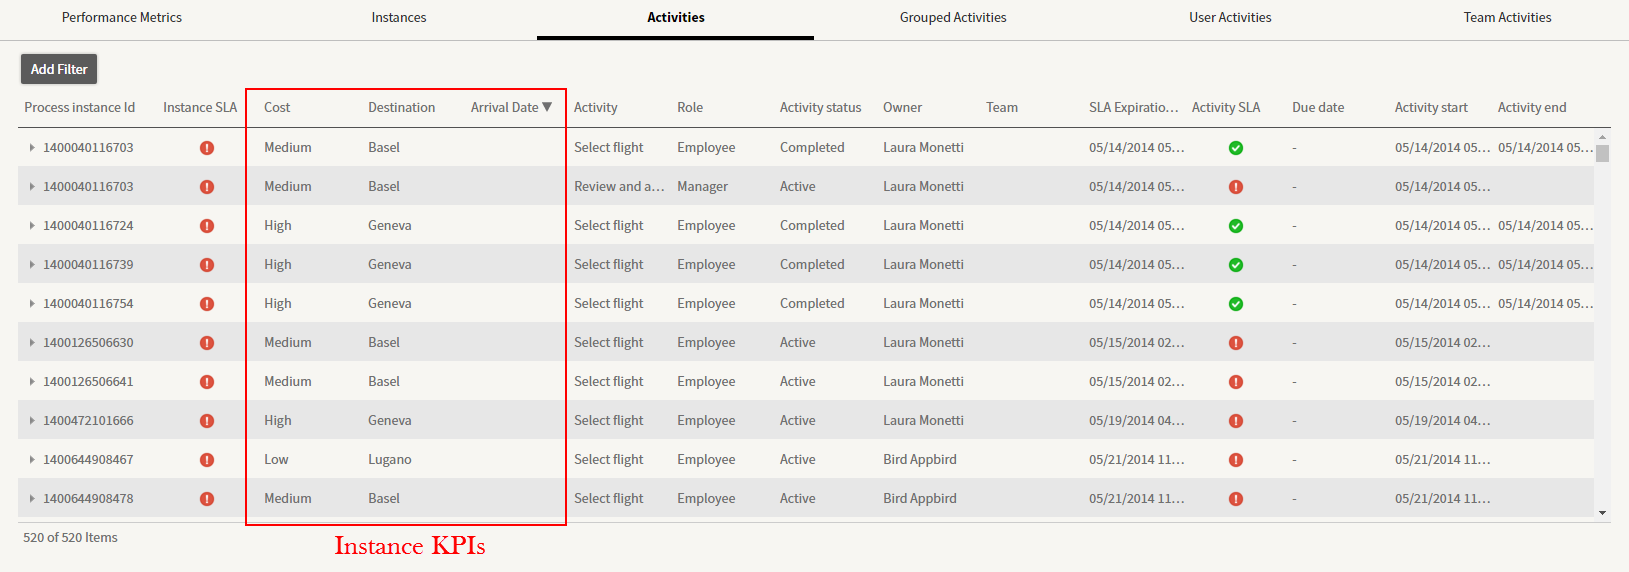
BAM Dashboards: Activities dashboard
Opening an activity interline by clicking on the small arrow on the left of the Process instance ID allows the user to drill down into details about the container process instance that includes the selected activity. The details on top of the interline include a list of the instance’s standard and custom properties. Standard properties are:
- Process
- Scenario name
- Status
- Creation date
- Last modification date
In addition, the interline shows a list of KPIs. The list of KPIs to be included is configured for each process in a dedicated catalog, as described in the KPI Configuration section. The data on the left of the interline is retrieved using the function GetInstanceOverview.
The bottom part of the interline displays a table which contains a list of all activities that have been performed or are being performed in the same process instance as the selected activity.
For each activity, the table displays:
- Name
- Role
- Status
- SLA status
- Expiration time
- Due date (in red if already overdue)
- Team
- Owner
- Start time
- End time (if completed)
The activity name column contains the element name of the activity in the process by default. To display the element tasklist name instead of the element name, create an Appway configuration property with the name bam.show.taskListName and set it to true.
In addition, the table shows a set of activity-level KPIs in dedicated columns. The list of activity-level KPIs to be included is configured for each process in a dedicated catalog, as described in the KPI Configuration section. The activities are indented based on how they are nested inside Sub-Processes of the main process. The data for the right of the interline is retrieved using the function GetInstanceActivities.
If an activity has been reassigned one or more times, the table includes one additional row for each reassignment. The row shows the owner (user or team), the start time of the assignment and the end time of the assignment (if completed/ further reassigned). This gives an insight into the list of people and teams who worked on the task, and the how the total time spent on the task was distributed among these participants.
The interline can also be detached and opened in another browser window. To do this, click on the icon on the top-left of the interline section, directly above the words, "Instance Summary". Once the window is detached it becomes possible to search for other process instances using the search field.
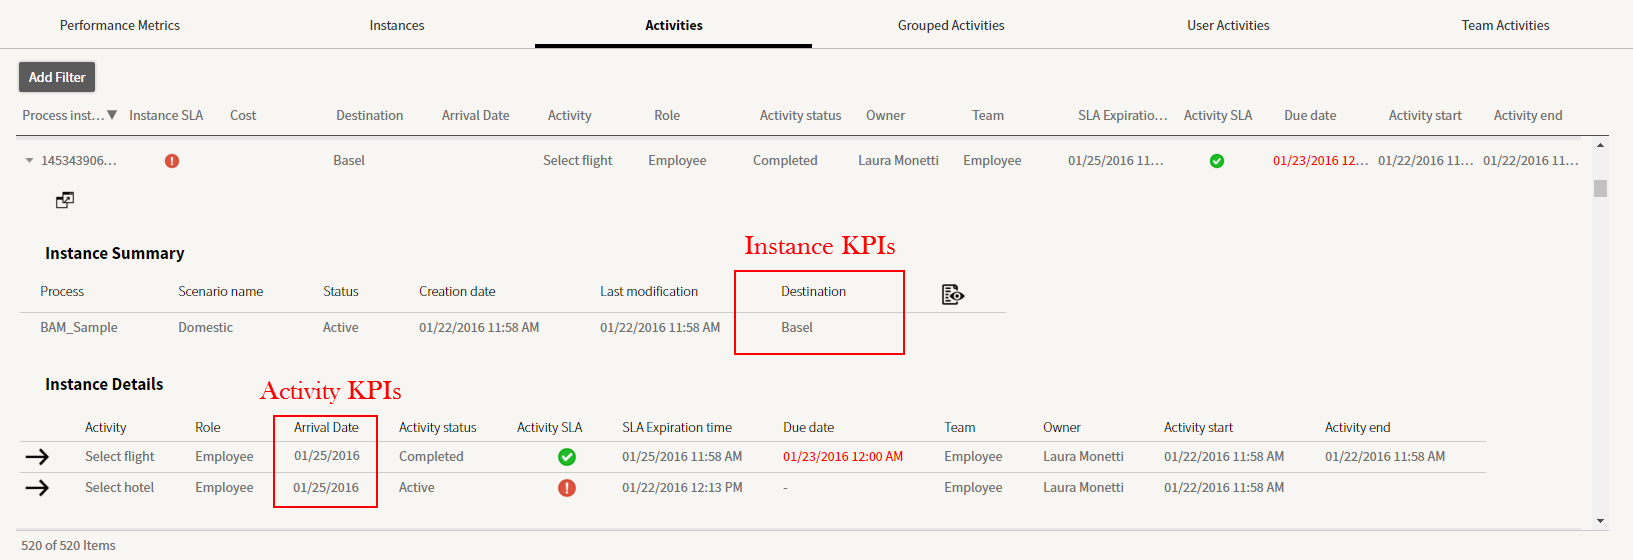
BAM Dashboards: process instance drill down from Activities dashboard
Grouped Activities
The Grouped Activities dashboard features a list of activities grouped according to four criteria:
- Activity name
- Role
- Status
- SLA status
The dashboard displays these groups in a table, together with the average duration inside the group, and the number of activities in the group. This allows the user to identify critical activities in the process that frequently exceed the expected duration. The table provides sorting and filtering capabilities for each column. The data is retrieved using the function GetActivityOverview.
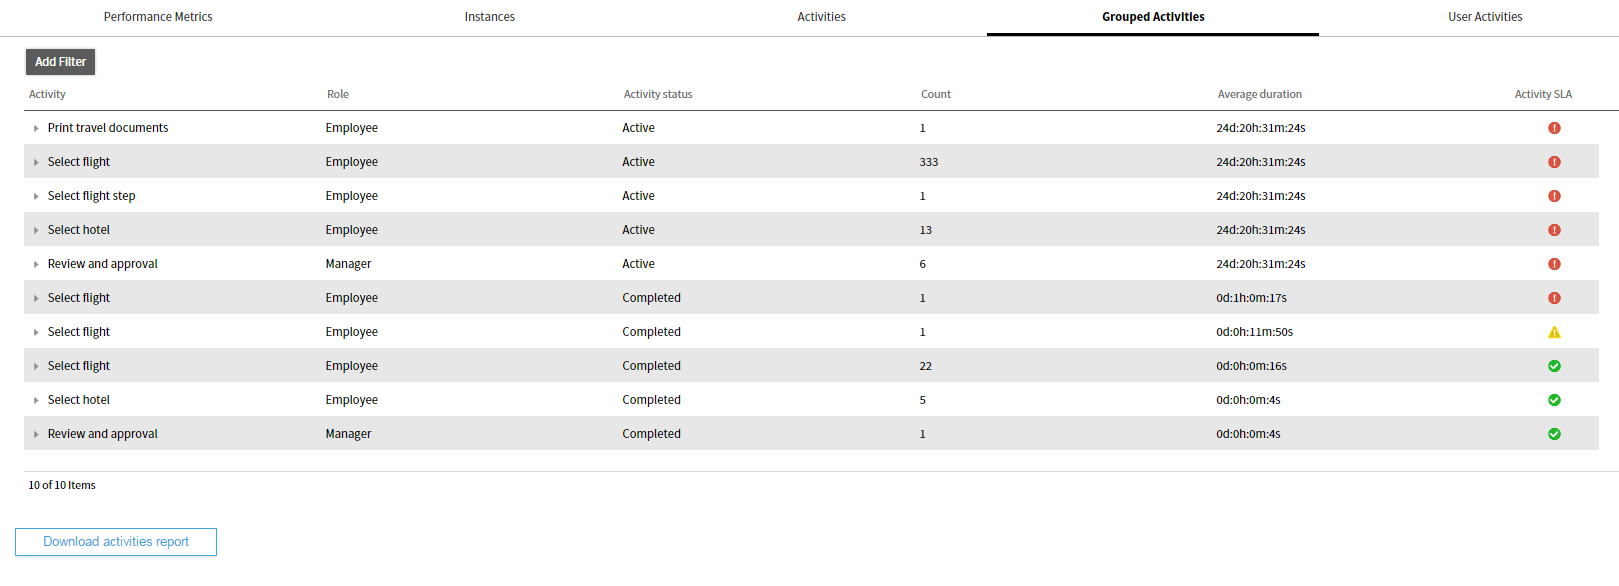
BAM Dashboards: Grouped Activities dashboard
The activity name column contains the element name of the activity in the process by default. To group by, and display, the element tasklist name instead of the element name, create an Appway configuration property with the name bam.show.taskListName and set it to true.
Users can drill down into the details of a specific group by opening the interline of a row in the table. To open the interline, click on the small arrow to the left of the task name. The interline displays details about all the activities in the selected group. The columns displayed for the list of selected activities are the same as in the Activities dashboard, but the drill down table only contains filtered activities. The data is retrieved using the function GetActivities.
Users can drill down further into the single instances by clicking on the Process instance ID column in the interline. Instance details then open in a new browser window.
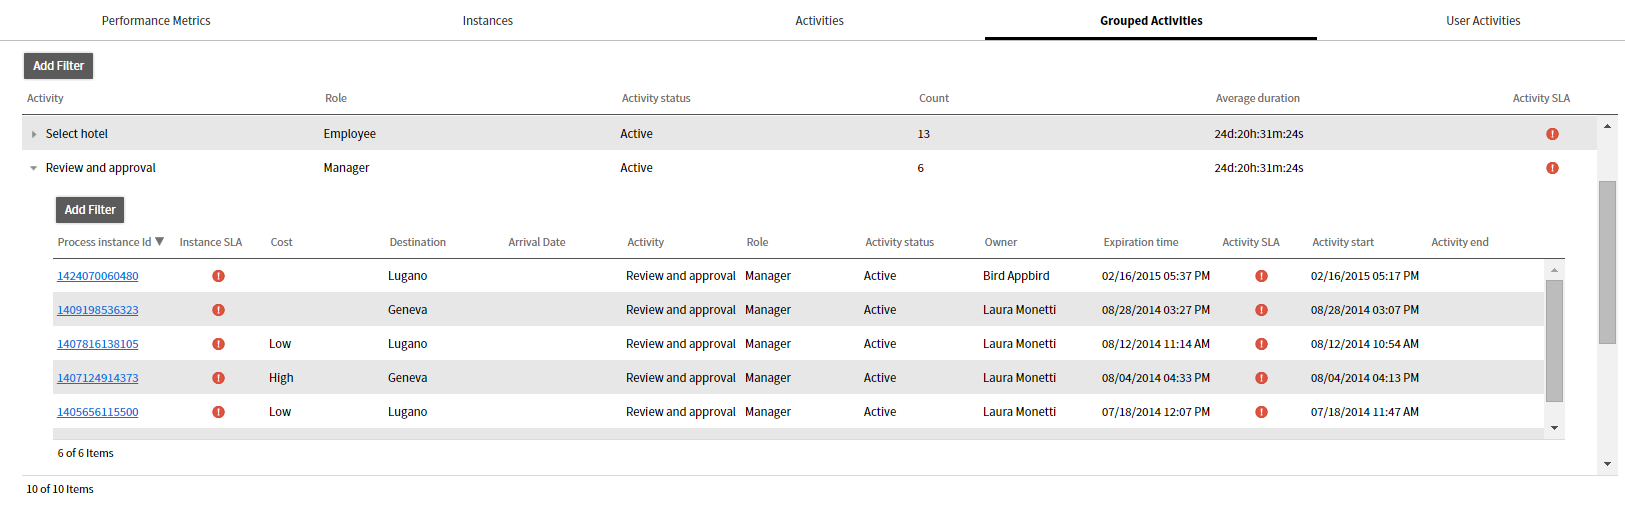
BAM Dashboards: activities drill down from Grouped Activities dashboard
User Activities
The User Activities dashboard displays activities focused on users/groups. The dashboard includes activities grouped by user ("Owner") and status, including the total number of activities per user, and the number of red, green, yellow and no SLA ("none") activities per user. If the activity is currently assigned to a group or role, the name of the group/role is displayed instead of the user name. The table provides sorting and filtering capabilities for each column. The data is retrieved using the function GetUserActivities.
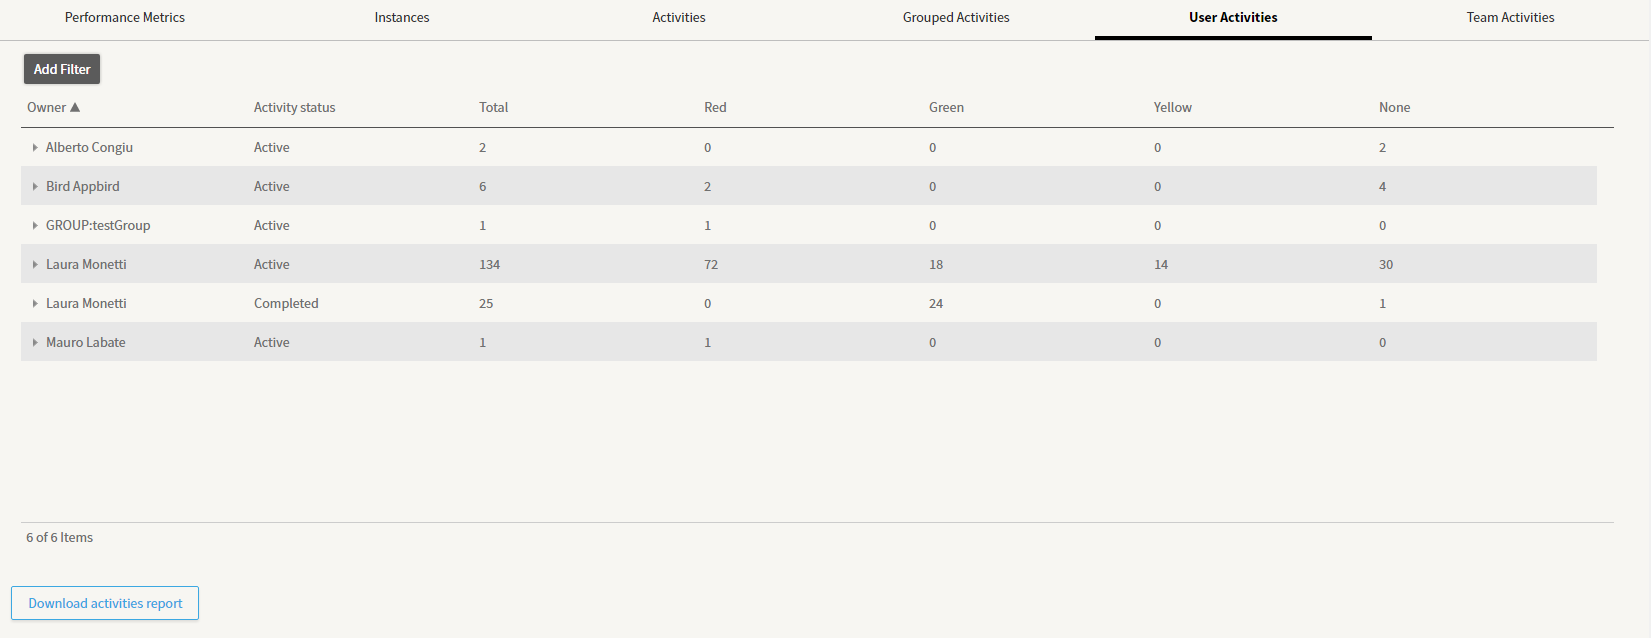
BAM Dashboards: User Activities dashboard
Users can drill down into the details of a specific group of activities by opening the interline of a row in the table. To do this, click on the small arrow to the left of the Owner name.
For example, you may need to browse the details of all active activities assigned to a specific user. Opening the interline will show details about all the activities in the selected group, displaying activity information together with instance-level data. The columns displayed for the list of selected activities are the same as in the Activities dashboard, but the drill down table only contains activities filtered by user. The data is retrieved using the function GetActivities.
Users can also drill down further into the single instances by clicking on the Process instance ID column in the interline. This opens the instance details in a new browser window.
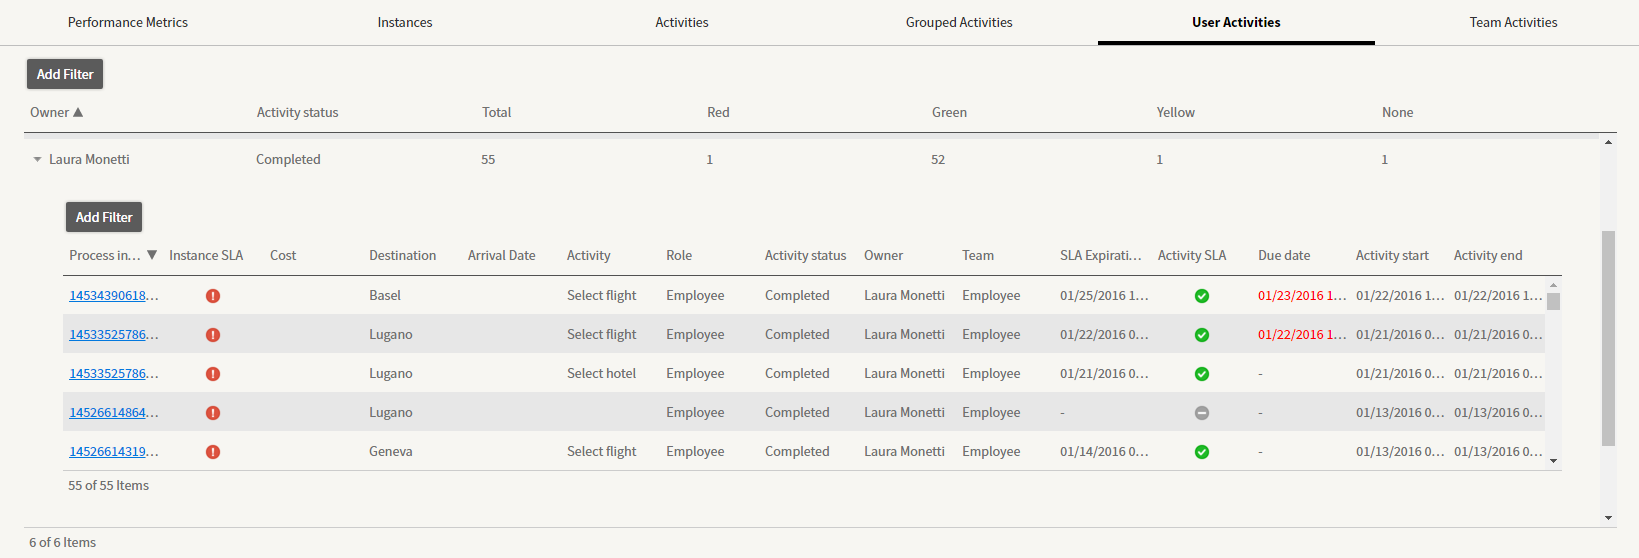
BAM Dashboards: activities drill down from User Activities dashboard
Team Activities
The Team Activities dashboard displays activities grouped by the owning team. The dashboard includes activities grouped by team and status, including the total number of activities per team and the number of red, green, yellow and no SLA ("none") activities per team. The table provides sorting and filtering capabilities for each column. The data is retrieved using the function GetTeamActivities.
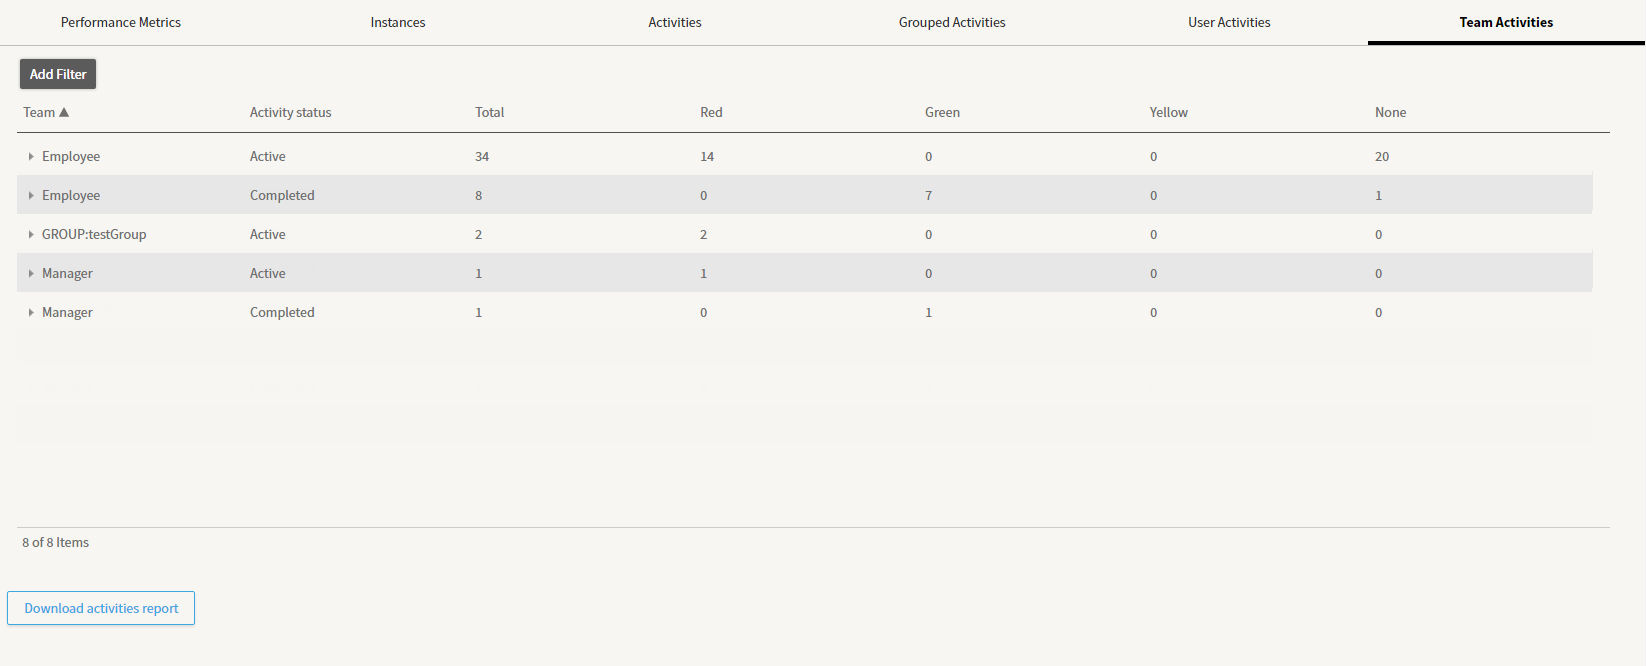
BAM Dashboards: Team Activities dashboard
By default, the team owner of an activity is defined as the name of the swimlane where the activity is located. It is optionally possible to update the team when the activity is assigned to a group or role (see the Additional Configuration section). If it is necessary to define a custom team assignment strategy, it is possible to set the token attribute BAM_teamId whose value is used by BAM as owner team for the activity instead of the default value.
Users can drill down into the details of a specific group of activities by opening the interline of a row in the table. To do this, click on the small arrow to the left of the Team name.
For example, you may need to browse the details of all active activities assigned to a specific team. Opening the interline shows details about all the activities in the selected group, displaying activity information together with instance-level data. The columns displayed for the list of selected activities are the same as in the Activities dashboard, but the drill-down table only contains activities filtered by team. The data is retrieved using the function GetActivities.
Users can also drill down further into the single instances by clicking on the Process instance ID column in the interline. This opens the instance details in a new browser window.
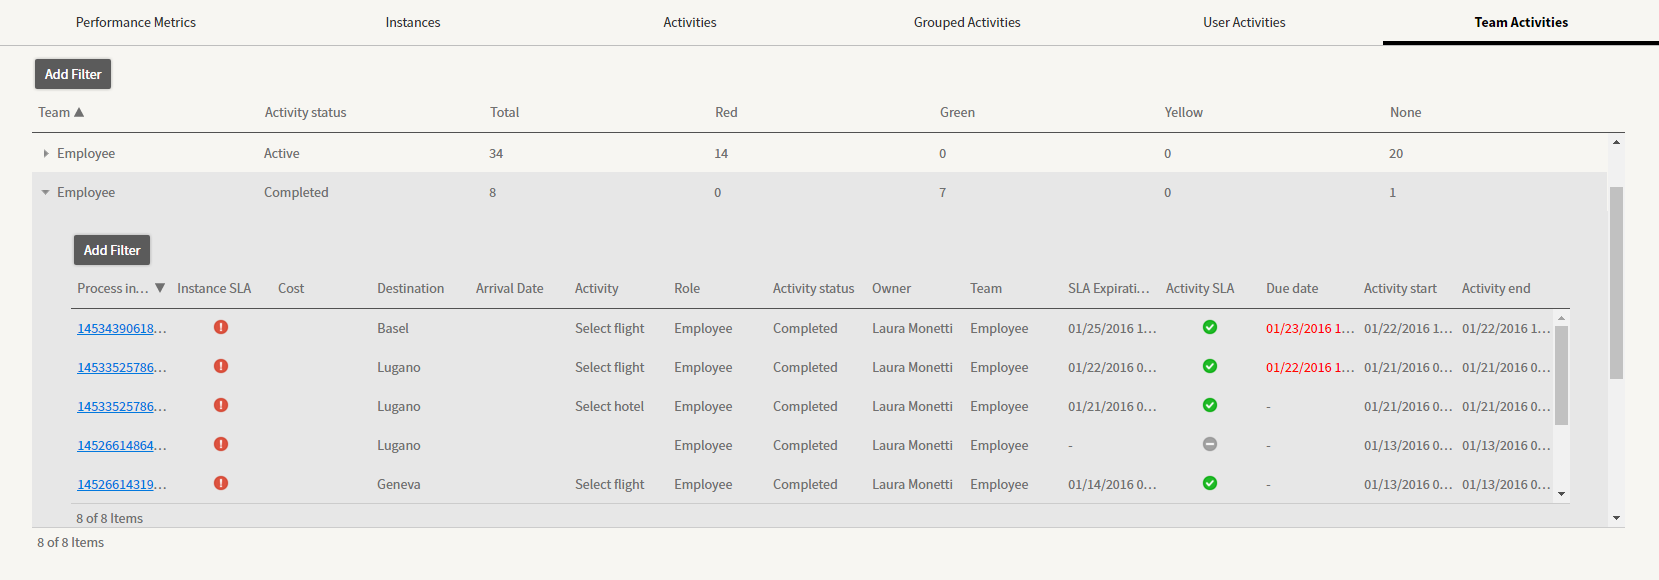
KPI Configuration
BAM Dashboards can contain custom business indicators (or KPIs) defined for a specific process. Users can define such indicators on two levels: process instance level and activity (token) level. Thanks to token-level KPI tracking, users can set different values for the indicator for different sub-processes running in parallel inside the same process instance, for example.
The set of process instance-level KPIs to be used in the dashboards for this purpose must first be defined in the catalog, BAM_Attributes. This catalog is created automatically when importing the out-of-the-box dashboards. Similarly, the set of token-level KPIs must be defined in the catalog BAM_TokenAttributes, also created automatically during this import.
The BAM_Attributes catalog contains one row per instance-level KPI and includes the following columns.
| Column Name | Description |
|---|---|
| id | ID of the KPI |
| description | User-friendly description displayed on the dashboard screens |
| filter | Defines whether the KPI can be used for filtering in the KPI Filters area of the filtering bar ('true'|'false').If true, the KPI will appear in the KPIs dropdown selector. |
| display | Defines where the KPI is displayed
|
| processes | Defines the list of processes the KPI is relevant for. This could be:
|
| type | Defines the type of KPI and is only mandatory for Date and Time KPIs If the KPI is not one of these two types, the column can be left blank. |
| catalog | The ID of the catalog to be used as a source for the list of possible values of the KPI. If a catalog ID is specified, the KPI filtering area will show a dropdown menu instead of a text field for KPI value selection. In all places where the KPI value must be displayed (tables, reports, filters), the value will be decoded using the specified catalog: the actual value will be used as 'id' in the catalog and the 'description' column will be shown instead. When filtering data table columns that display the KPI, the filter value selection will be a dropdown menu instead of a text field. |
| multiselect | Defines whether the end user should have the option of selecting more than one filter value for the KPI ('true'|'false').This only applies if the filter column is set to true and if the catalog column is populated. If true, the KPI filtering area will show a checkbox list instead of a dropdown menu for KPI value selection. Each checkbox will correspond to one of the entries in the catalog specified in the column catalog. |
Table 18: Configuration of the BAM_Attributes catalog
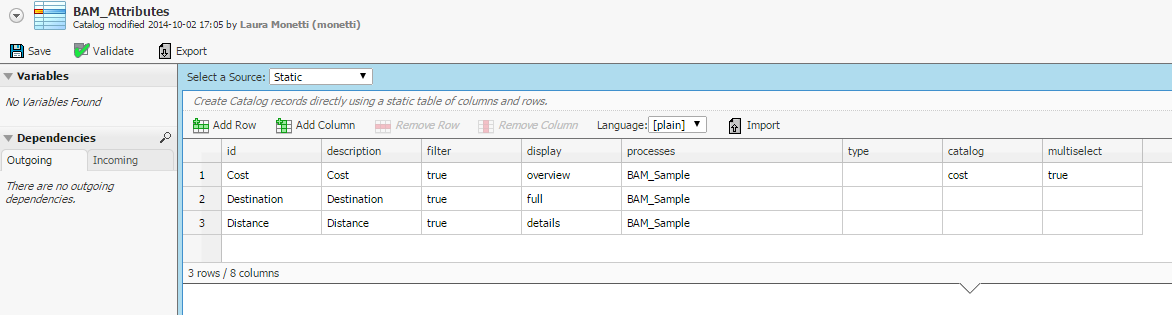
BAM_Attributes catalog to configure instance-level KPIs
The BAM_TokenAttributes catalog contains one row per token-level KPI and includes the following columns:
| Column Name | Description |
|---|---|
| id | ID of the KPI |
| description | User-friendly description displayed in the dashboard screens |
| display | Defines where the KPI is displayed
|
| processes | Defines the list of processes the KPI is relevant for. This could be:
|
| type | Defines the type of KPI and is only mandatory for Date and Time KPIs If the KPI is not one of these two types, the column can be left blank. |
| catalog | The ID of the catalog to be used as a source for the list of possible values of the KPI. If a catalog ID is specified, the value is decoded using the specified catalog in all places where the KPI value must be displayed (tables, reports, filters). The actual value is used as 'id' in the catalog and the 'description' column is shown instead. When filtering data table columns that display the KPI, the filter value selection will be a dropdown menu instead of a text field. |
Table 19: Configuration of the BAM_TokenAttributes catalog
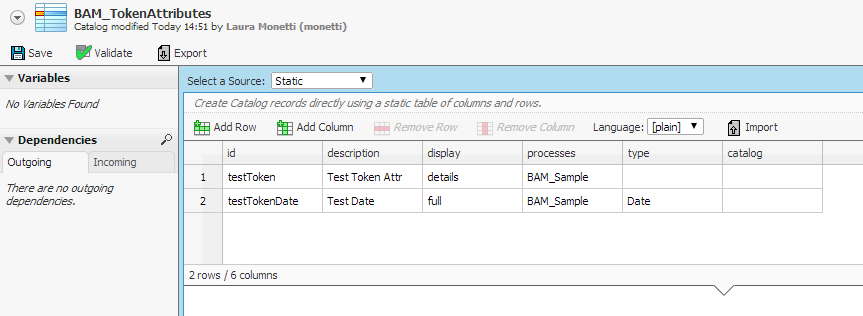
BAM_TokenAttributes catalog to configure token-level KPIs
Trackpoints
The Appway BAM extension provides a visual way for users to set BAM-relevant process instance and process token KPIs: trackpoints. Trackpoints are a dedicated component available in the process editor.
Using trackpoints requires KPIs to be defined. Once the KPIs have been defined in the BAM_Attributes and BAM_TokenAttributes catalogs, it is then possible to set a value for each of them inside the relevant processes. For information on how to define KPIs in these catalogs, please see the KPI Configuration section.
A BAM trackpoint allows the user to set a BAM-relevant process instance KPI or process token KPI to a static value or an expression by placing the trackpoint on an element or connection inside the process. The KPI is set to the selected value when a token enters the element or connection where the trackpoint is located, and is immediately saved to the BAM database.
In case of a process instance-level KPI, the value is saved on the current process instance. In case of a token-level KPI, the value is saved on the current process token only (and it will not be propagated to the subsequent tokens). It is therefore important to remember that it only makes sense to place token-level trackpoints on screens and sub-processes, as other types of tokens — such as the ones on connections — are not tracked by BAM.
The trackpoint properties include the selection of the Attribute Level (Process Instance/Process Token), the Attribute Name and the Attribute Value. Users can select the KPI name from a dropdown menu that includes all KPIs that are listed in the BAM_Attributes or BAM_TokenAttributes catalogs (depending on the selected Attribute Level) for the current process (see processes column). The KPI value can be a static value, or the result of the evaluation of an expression.
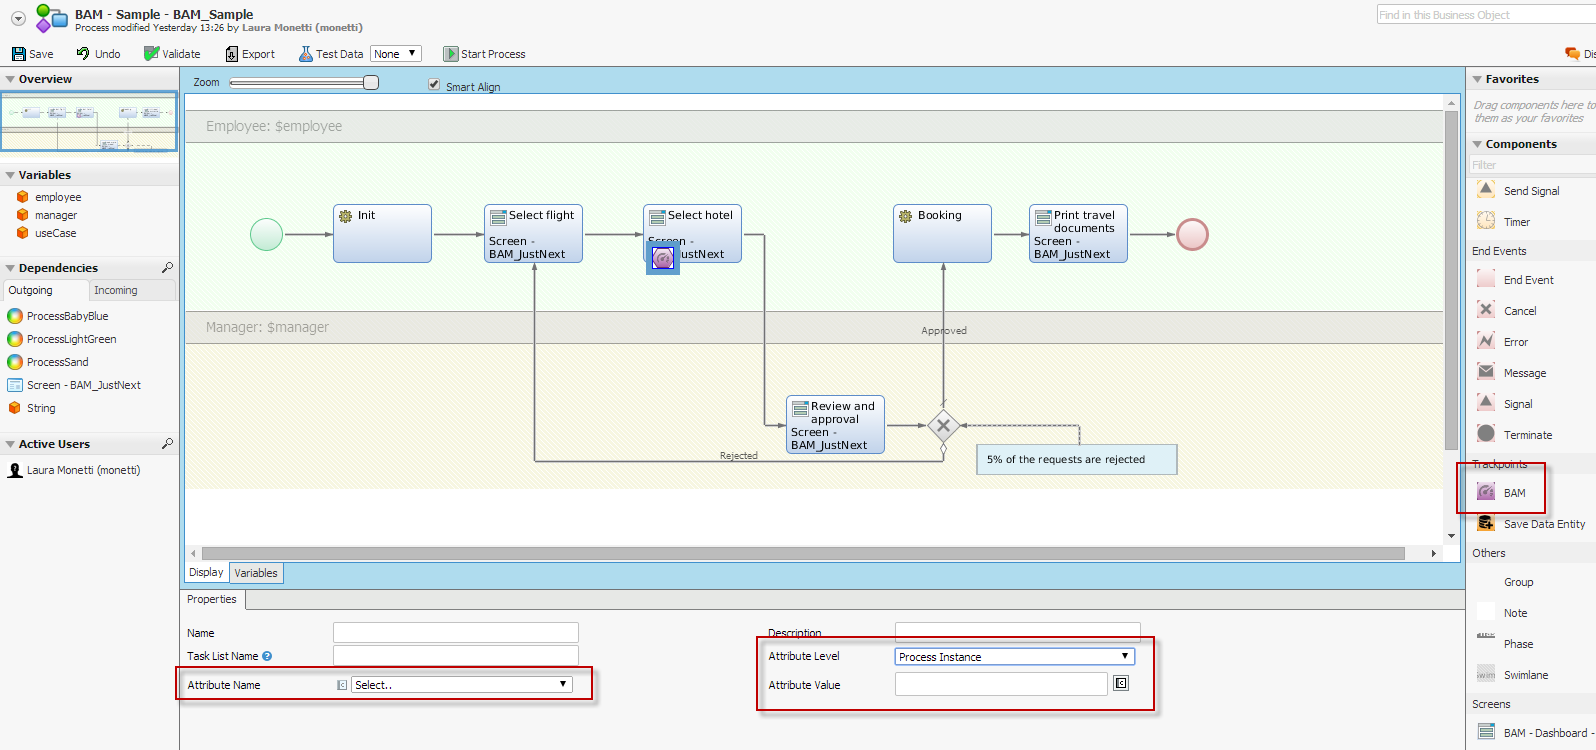
Example of BAM trackpoint configuration inside the process modeler
Should using trackpoints not be possible, the BAM extension allows KPIs to be saved using standard process instance and token attributes. To do this, set the extension properties bam.instance.attributes.enabled and/or bam.token.attributes.enabled to true as described in the Additional Configuration section.
In this case, all attributes set using the standard functions ProcessInstanceSetAttribute and/or ProcessTokenSetAttribute will also be saved to the BAM database without the need to use trackpoints. In addition, the token level attributes will be propagated to the subsequent tokens according to the Appway process engine rules. If the KPIs set using process instance/token attributes need to be displayed in the BAM dashboards, they must be configured in the BAM_Attributes/ BAM_TokenAttributes catalogs in the same way as for KPIs set using trackpoints.
Consider the following restrictions:
- Attributes added before BAM is installed and configured on a Process are not tracked. This is because the following conditions must apply for tracking Process Instance attributes:
- The function
ProcessInstanceSetAttributemust be invoked for the Process Instance after the Process has been configured to be tracked by BAM. - When the function
ProcessInstanceSetAttributeis invoked, the attribute must not exist already in the Process Instance (if it exists already, an update statement is issued on the BAM Database, but no row to be updated is found).
- The function
- One attribute (with one ID) cannot be tracked with trackpoints and Process Instance attributes at the same time, as this might result in unexpected behavior or missing updates. However, some KPIs can be tracked with trackpoints and others with Process Instance attributes.
Reports
The out-of-the-box dashboards include a spreadsheet-based reporting feature. Full or filtered sets of instances and activities can be exported to MS Excel.
Instance Report
The instances report contains data about a set of process instances. The report is generated with the POI extension, using the template BAM_InstancesReport. Users can download the report from the Instances dashboard by clicking on the button Download Instances Report at the bottom of the page. The report contains data about all instances that satisfy the filters specified in the top filtering bar (process, status, etc.).
The columns of the spreadsheet generated include:
- Basic instance information
- process instance ID
- process ID
- status
- scenario name
- instance start
- expiration time
- instance SLA
- All process instance-level KPIs defined for the selected process, independent of the value that was set for the KPI in the
displaycolumn of the BAM_Attributes catalog
The data is retrieved using the function GetInstancesOverview.
Activities Report
The activities report contains data about a set of activities. The report is generated with the POI extension using the template BAM_ActivitiesReport, and can be downloaded from the Activities, Grouped Activities, User Activities and Team Activities dashboards by clicking the Download Activities Report button at the bottom of the respective page. The report contains data about all activities that are included in process instances that satisfy the filters specified in the top filtering bar (process, status, and so on).
The same result can be achieved from the activity drill-down section opened when selecting a row in the Grouped Activities, User Activities and Team Activities dashboards. In this case, the report contains data about the subset of selected activities, that is, those that belong to the selected group. The columns of the spreadsheet generated include:
Basic instance information
- process instance ID
- process ID
- instance status
- scenario name
- instance start
- instance expiration time
- instance SLA
Activity information
- activity
- role
- activity status
- owner
- activity start and end time
- activity due date
- activity expiration time
- activity SLA
All process instance-level and token-level KPIs defined for the selected process, regardless of the value that was set for the KPI in the
displaycolumn of the BAM_Attributes and BAM_TokenAttributes catalogs.
The data is retrieved using the function GetActivities.
Dashboard Customization
Dashboards can be customized within the Appway BAM extension to suit business needs. This chapter covers the architecture, templates and customization guidelines for the BAM Dashboards.
Screen Structure and Templates
Understanding how BAM Dashboards are modeled is key when considering customization. This section describes the architecture of the dashboards.
The out-of-the-box dashboards are implemented with a process called BAM – Dashboards. This process always displays the BAM – Dashboards screen, unless no SLAs have been configured. If no SLAs have been configured, an error screen is displayed.
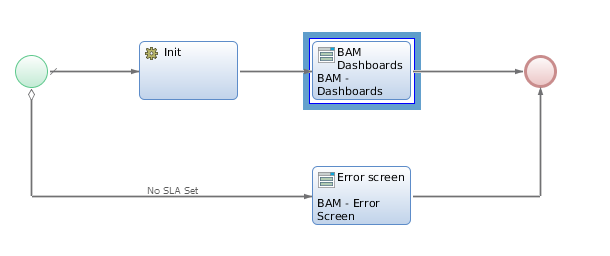
“BAM – Dashboards” process
The BAM – Dashboards screen contains one screen template component (Template – BAM), which is the implementation of the out-of-the-box features. This template provides multiple areas where developers can include additional custom features, like custom dashboards and charts. This template is contained inside another template component which can be used to include the BAM dashboard screens inside an existing solution template, if necessary.
If the configuration property “solution.templateid.bam” is set in the Appway environment, the Screen whose ID is specified as content of the property is used as a wrapping template for the BAM dashboards. For example this could be the template used across all the screens of the solution, and it could include a top header with logo and links, and a left or right side menu.
If a solution template is specified, the BAM dashboards' content is placed inside the CONTENT placeholder of the selected template, and no other placeholder of the template is filled.
The BAM – Dashboards screen is the screen to be modified if users wish to customize dashboard behavior.
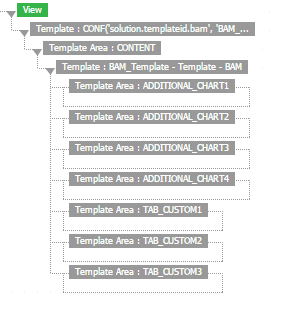
“BAM – Dashboards” screen implementation in the screen editor
The Template – BAM screen defines the frame of the dashboard screens.
It consists of a top area with the filtering criteria, and a lower area with BAM data organized in tabs.
The only aspect that can be customized in the filtering area is the list of KPI Filters. How to customize KPI filters is described in the KPI Configuration section.
As for the data area, five dashboards are provided in the out-of-the-box solution and are displayed in dedicated tabs. Three additional dashboards are available for custom content and can be enabled by following the procedure outlined in the New Dashboard section.
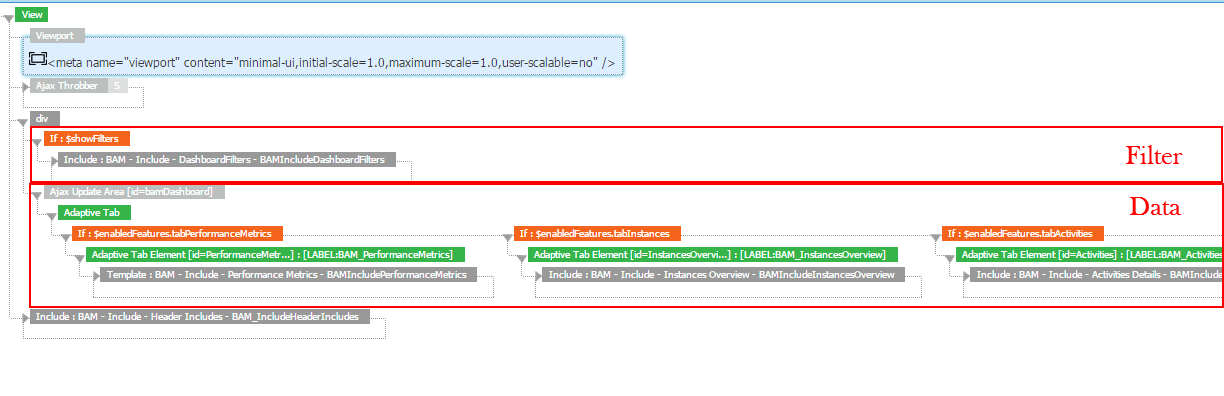
BAM Dashboards and Template – BAM structure
The Template – BAM screen also contains a BAM - Include - Header Includes screen that imports the CSS resources. The CSS resources can be customized, as described in the Dashboard CSS section.
Supported Customization Types
The out-of-the-box dashboards are a set of Appway business objects and can therefore be fully customized according to specific project needs. A set of commonly required customizations has been identified. These customizations are outlined in this chapter and are supported so as to avoid conflicts when installing a new compatible version of the BAM extension.
Please note that if the dashboard business objects are changed without following the Appway guidelines provided in this chapter, future upgrading of the BAM extension might result in conflicts and incompatibilities.
The supported customizations include:
- Changing the CSS used in the BAM Dashboards
- Creating up to four new charts in the Performance Metrics dashboard
- Removing one or more of the out-of-the-box charts in the Performance Metrics dashboard
- Creating up to three new dashboards
- Removing one or more of the out-of-the-box dashboards
- Defining custom Instance
Actionsin the instance drill-down view (Activity Detailsscreen) - Defining a custom Activity
Actionscolumn in the instance drill-down view (Activity Detailsscreen)
The dashboards are designed in a way that allows these customizations to be implemented by modifying a small subset of the BAM business objects:
Screens
- BAM - Dashboards
- BAM - Include - Activity Actions
- BAM - Include - Instance Actions
Catalogs: BAM_DefaultFeatures
These business objects are not changed when the BAM extension is updated to a newer version.
Any modification to the out-of-the-box dashboards that requires changing other business objects can lead to conflicts when updating the BAM Extension to a new version. An example could be changing the BAM - Include – DashboardFilters screen to implement a custom filtering condition. In such cases, the options are:
- Never install any future update of the out-of-the-box BAM Dashboards after customization
- Overwrite all local customization with a future version's default settings, which will occur when installing a new update of the out-of-the-box BAM Dashboards (therefore losing the customization work done previously)
- Carefully solve the conflicts between the two versions (local changes and new out-of-the-box version) by merging all the business objects manually. This activity must be performed in close collaboration with the Appway R&D Department. There is no guarantee that a new BAM version will support local customizations.
Customization Guidelines
The BAM_DefaultFeatures catalog controls all the enabled dashboard features, such as which dashboards are displayed, which charts are enabled and which resources must be included. The following sections provide details about every configuration option.
Dashboard CSS
The CSS styles included by default in the BAM dashboards can be changed by following these steps:
- Duplicate the CSS resource with the ID
BAM_Stylesand give it a new arbitrary ID (e.g.Custom_BAM_Styles). - Change the
confcolumn for thecssResourceIdentry in theBAM_DefaultFeaturescatalog to match the newly-chosen ID.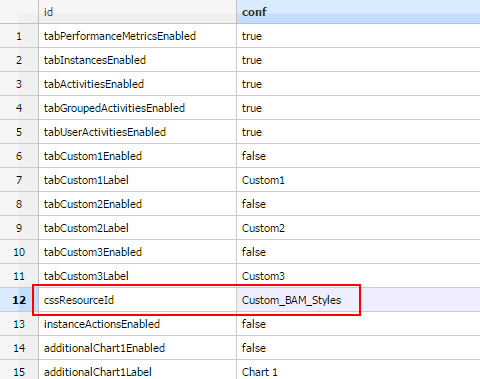
BAM_DefaultFeatures catalog configuration for changing the CSS resource 3. Modify the new CSS resource to achieve the desired dashboard look and feel. This is a standard CSS file, so standard styling techniques can be applied.
New Performance Metrics Charts
Up to four new charts can be added to the Performance Metrics dashboard. To add a chart, follow the steps below:
- Create a new screen that will host the chart and give it an arbitrary ID (e.g.
BAMIncludeCustomChart). - Enable the first custom chart by setting the
confcolumn for theadditionalChart1Enabledentry totruein theBAM_DefaultFeaturescatalog. - Change the
confcolumn for theadditionalChart1Labelentry in theBAM_DefaultFeaturescatalog to set the desired chart title.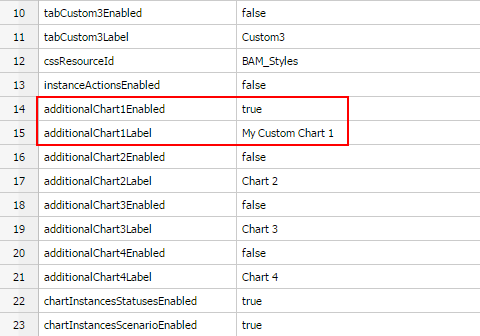
BAM_DefaultFeatures catalog configuration for enabling a custom chart - Include the custom chart screen in the
BAM – Dashboardsscreen inside the template areaADDITIONAL_CHART1.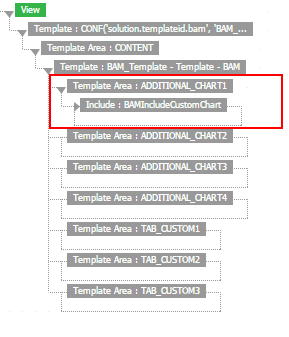
Inclusion of a custom chart screen in the “BAM – Dashboards” screen - Modify the custom chart screen in order to implement the desired chart. The variable context can be inherited from the
BAM – Dashboardsscreen to make the chart dependent on user selections. For example, it is possible to inherit thefiltervariable of typeBAMFilterto access the current filter selection: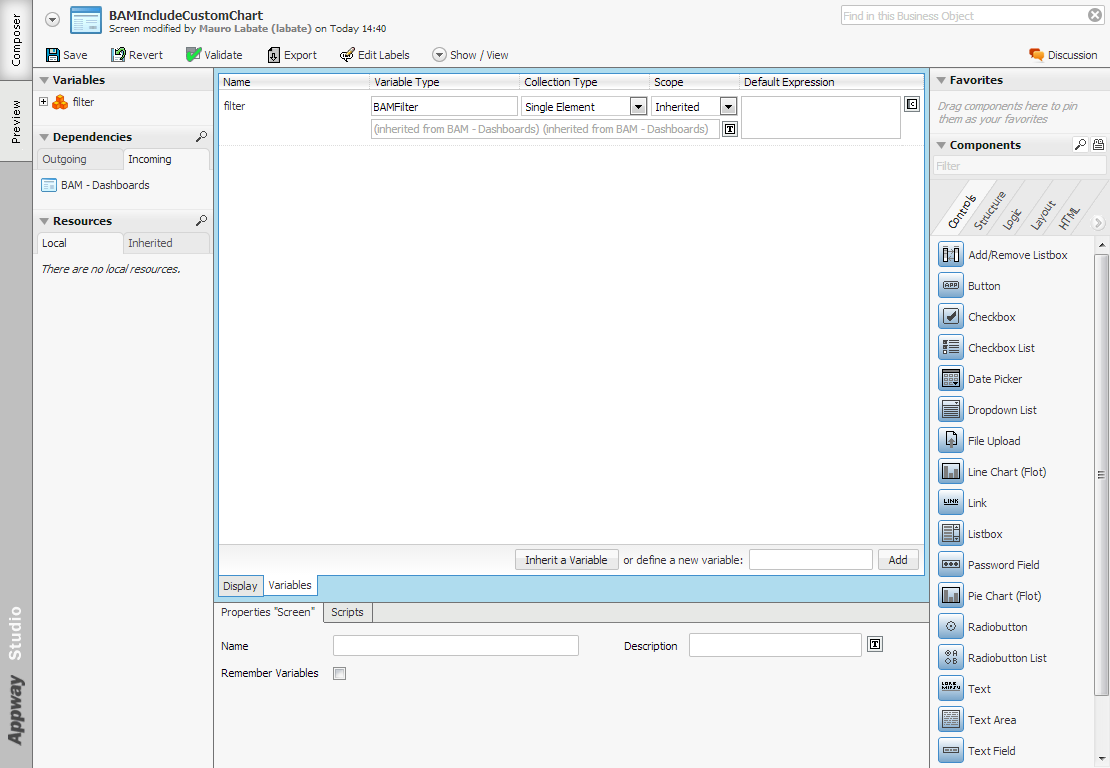
Inheritance of the “filter” variable in the custom chart screen
A new chart can reuse one of the existing Appway BAM extension functions and just modify the data formatting/presentation, or it can be implemented using any arbitrary logic (e.g. a custom query on the BAM database).
Up to four charts can be added by following this procedure, just substituting a different catalog entry ID number for each additional chart. For example, for the second chart, the properties to be updated are additionalChart2Enabled and additionalChart2Label, and so on.
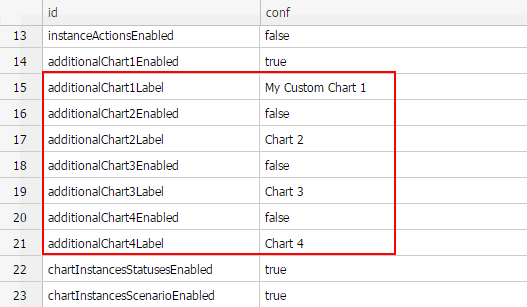
BAM_DefaultFeatures catalog configuration for enabling/disabling additional custom charts
Remove Out-of-the-Box Performance Metrics Charts
In order to remove one or more of the out-of-the-box charts on the Performance Metrics dashboard, users are required to update the BAM_DefaultFeatures catalog: Set the conf column corresponding to the chart to be removed to false. In the image below, the charts are matched with the corresponding properties to be enabled/disabled.
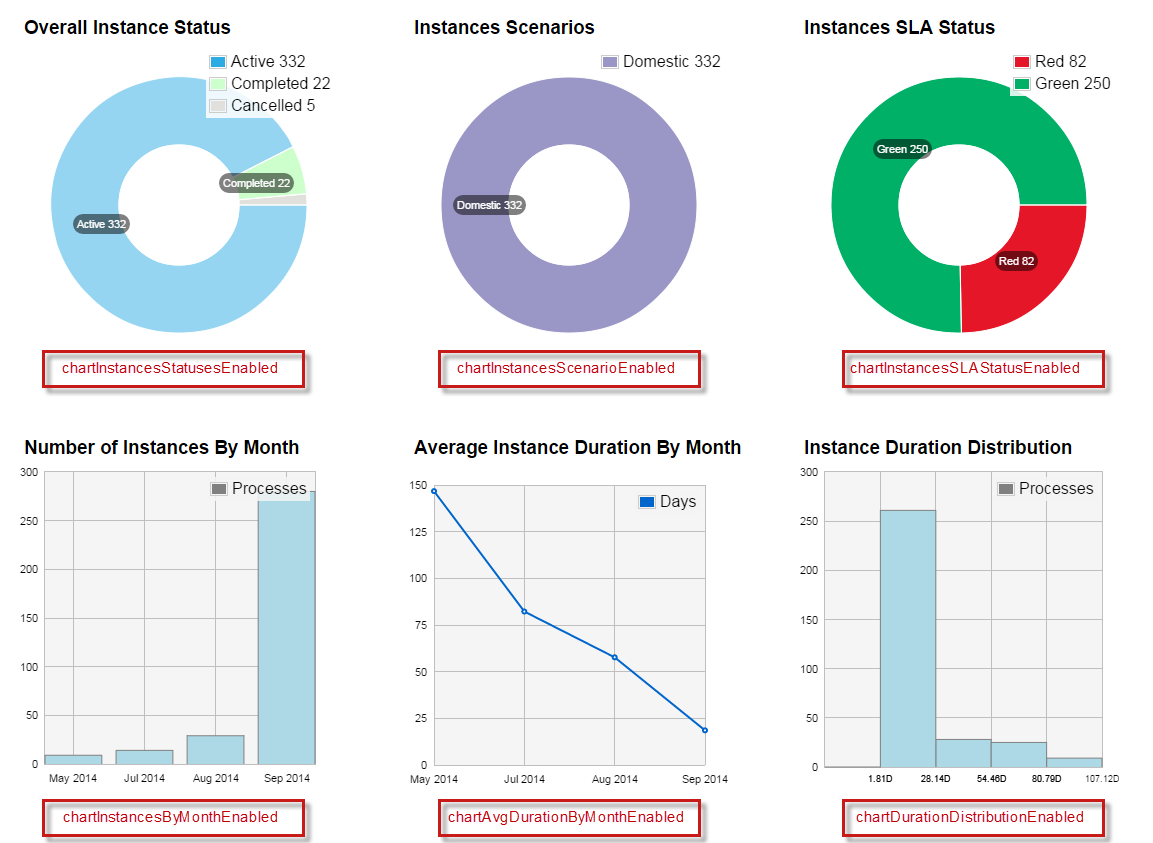
Correspondence of BAM default charts with BAM_DefaultFeatures catalog entries to be enabled/disabled
Add New Dashboard
Add up to three new dashboards by following these steps:
- Create a new screen that will host the content of the new dashboard, and give it an arbitrary ID (e.g.
BAMIncludeCustomDashboard). - Enable the first custom dashboard by setting the
confcolumn for thetabCustom1Enabledentry totruein theBAM_DefaultFeaturescatalog. - Change the
confcolumn for thetabCustom1Labelentry in theBAM_DefaultFeaturescatalog to set the desired dashboard title.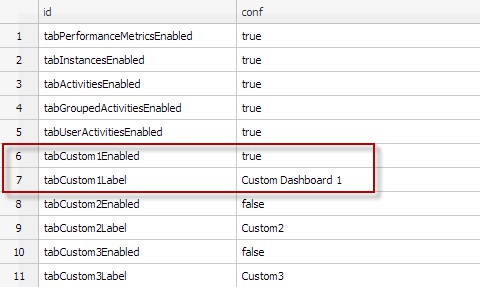
BAM_DefaultFeatures catalog configuration for enabling a custom dashboard - Include the custom dashboard screen in the
BAM – Dashboardsscreen inside the template areaTAB_CUSTOM1 - Modify the custom dashboard screen in order to implement the desired features. It is possible to inherit the variable context from the
BAM – Dashboardsscreen to make the chart dependent on user selections. For example, it is possible to inherit the BAMFilter object to access the current filter selection: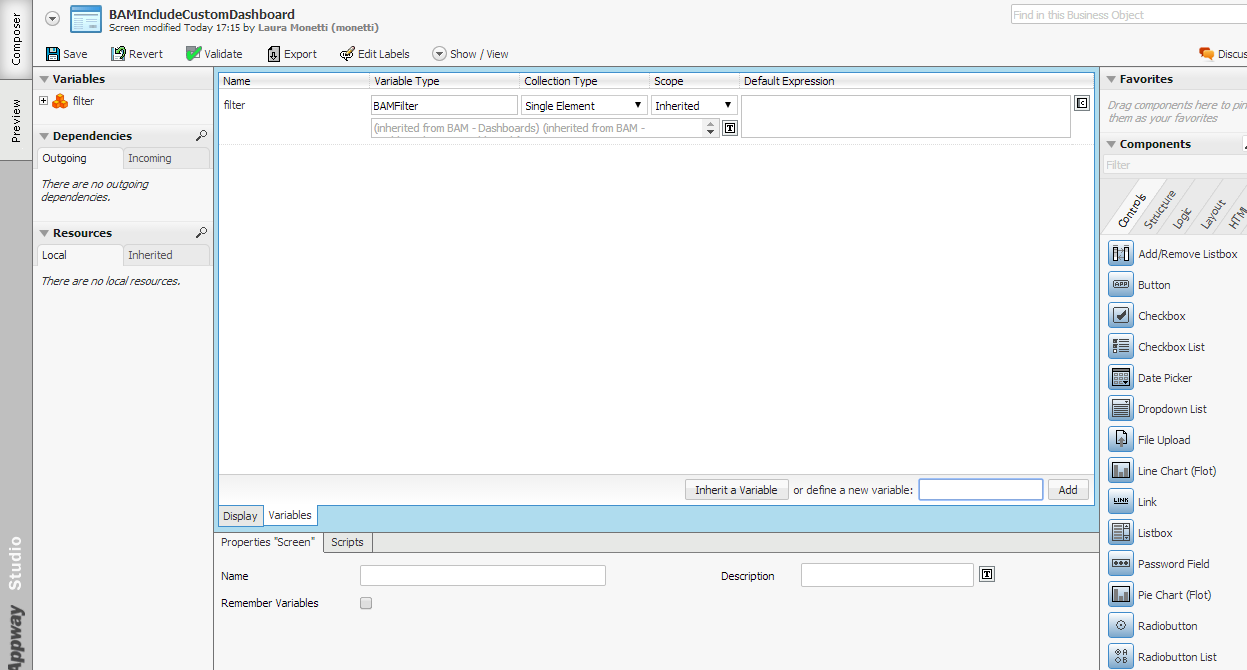
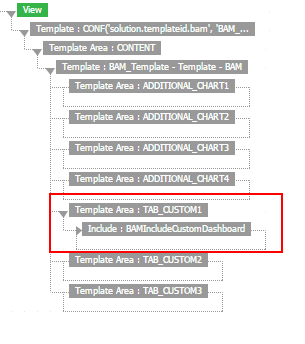
Inclusion of a custom dashboard screen in the “BAM – Dashboards” screen
Inheritance of the filter variable in the custom dashboard screen
A new dashboard can reuse existing BAM extension functions to obtain the desired dataset and just modify the data formatting/presentation, or it can be implemented using any arbitrary logic (e.g. a custom query on the BAM database).
Up to three dashboards can be added by following the procedure above, just substituting a different catalog entry ID number for each subsequent dashboard. For example, for the second custom dashboard the properties to be updated are tabCustom2Enabled and tabCustom2Label, and so on.
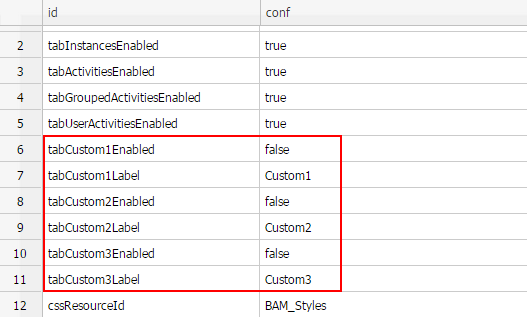
BAM_DefaultFeatures catalog configuration for enabling/disabling additional custom dashboards
Remove Out-of-the-Box Dashboards
In order to remove one or more of the out-of-the-box dashboards, update the BAM_DefaultFeatures catalog by setting the conf column corresponding to the dashboard to be removed to “false”.
- Performance Metrics: use the entry
tabPerformanceMetricsEnabled - Instances: use
tabInstancesEnabled - Activities: use
tabActivitiesEnabled - Grouped Activities: use
tabGroupedActivitiesEnabled - User Activities: use
tabUserActivitiesEnabled - Team Activities: use
tabTeamActivitiesEnabled
Custom Instance Actions in the Instance Drill Down View
In the instance drill-down view accessible from the Instances, Activities, Grouped Activities, User Activities and Team Activities dashboards, a special actions section can be enabled. This special actions section can implement custom actions to be executed on the selected instance.
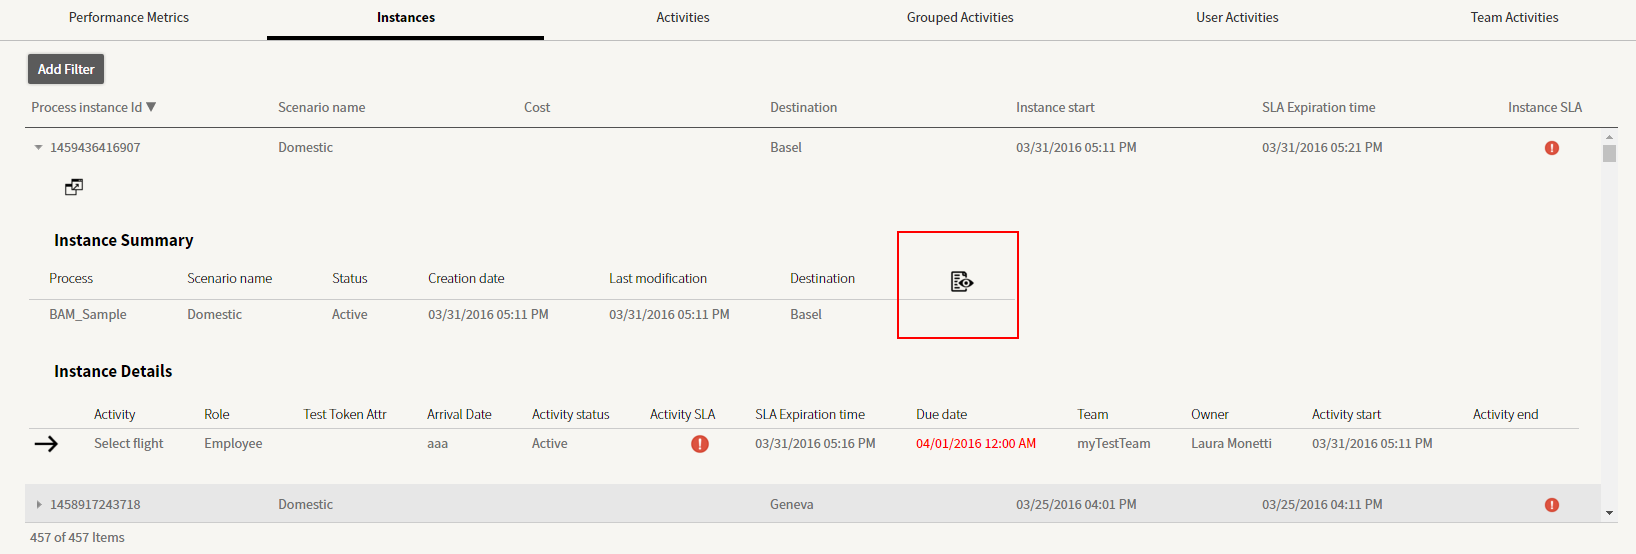
Custom action icon in the instance drill down view from the Instances dashboard
To enable custom actions in the instance drill-down:
- Enable instance actions by setting the
confcolumn for theinstanceActionsEnabledentry totruein theBAM_DefaultFeaturescatalog.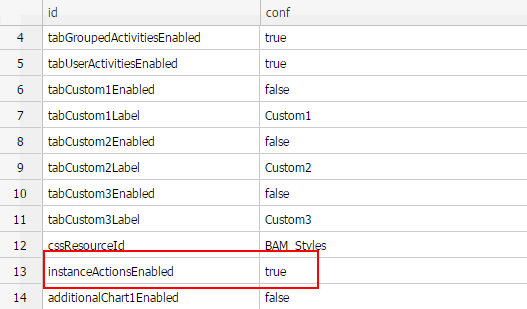
BAM_DefaultFeatures catalog configuration for enabling the “Actions” column in the instance drill down - Customize the
BAM – Include – Instance Actionsscreen according to project-specific needs. By default, it already contains a sampleviewaction that displays a confirmation popup. This sample action can be safely removed and is merely provided as an example of how to implement a custom action. In theBAM – Include – Instance Actionsscreen, two variables are already defined: thefilter(of type BAMFilter) which can be used to access the currently selected filters, and thedbRecordwhich is a named collection of strings containing the current process instance data. The `BAM – Include – Instance Actions" screen is included in the first table of the "BAM – Include – Activity Details" screen, which implements the instance drill down view. The variable "dbRecord" contains the result of the function "GetInstanceOverview" documented in the Functions section.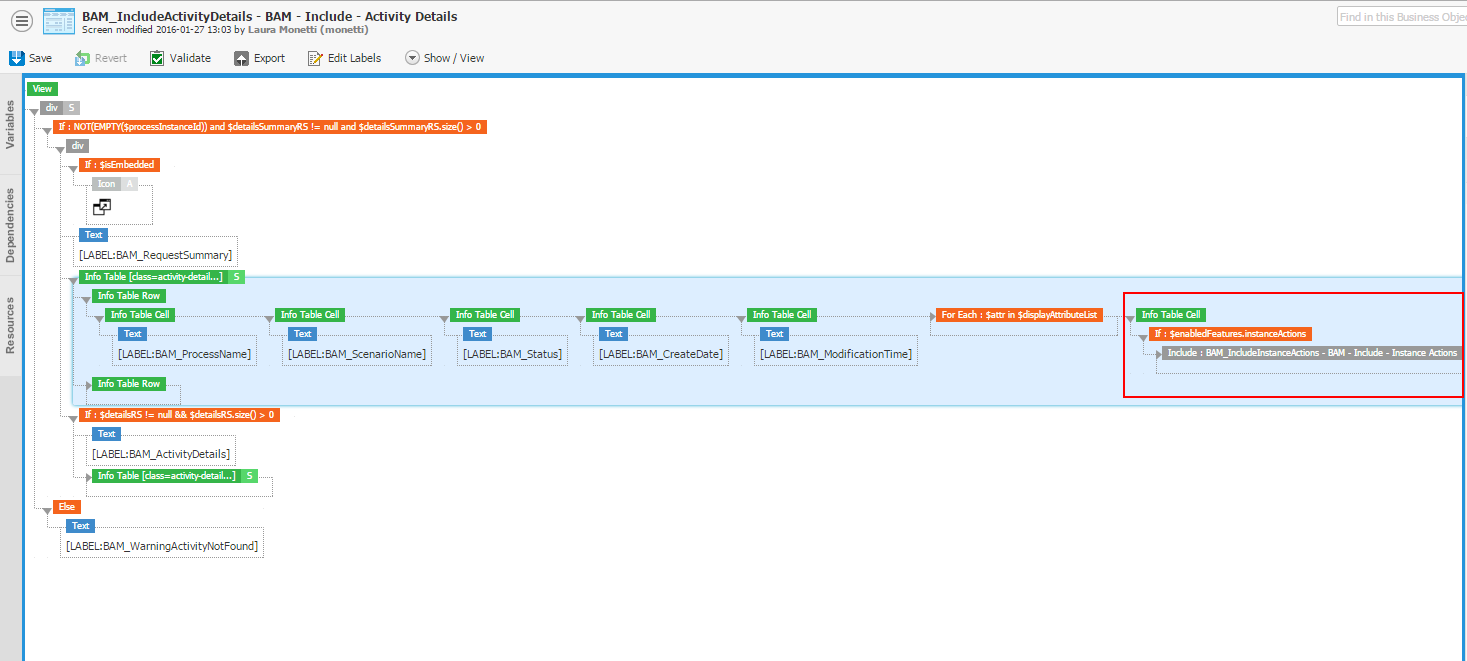
BAM – Include – Activity Details” screen and and inclusion of the “BAM – Include – Instance Actions” screen
Even though the actions screen can be fully customized, it is recommended that users only include a set of icons, each representing a specific action on the instance. For example view, reassign, delete, notify, and so on.
Using other type of components such as checkboxes or other controls is not covered as part of supported customization.
It is the developer’s responsibility to implement all the required checks in the custom actions screen in order to make sure that each action is only available if the instance is in an appropriate status. For example, the reassign action makes sense only for instances with the status Active.
Custom Activity Actions Column in the Instance Drill Down View
To implement custom actions to be executed on one of the activities displayed in the activities table in the instance drill-down view, users need to enable a special Actions column for the activities table.
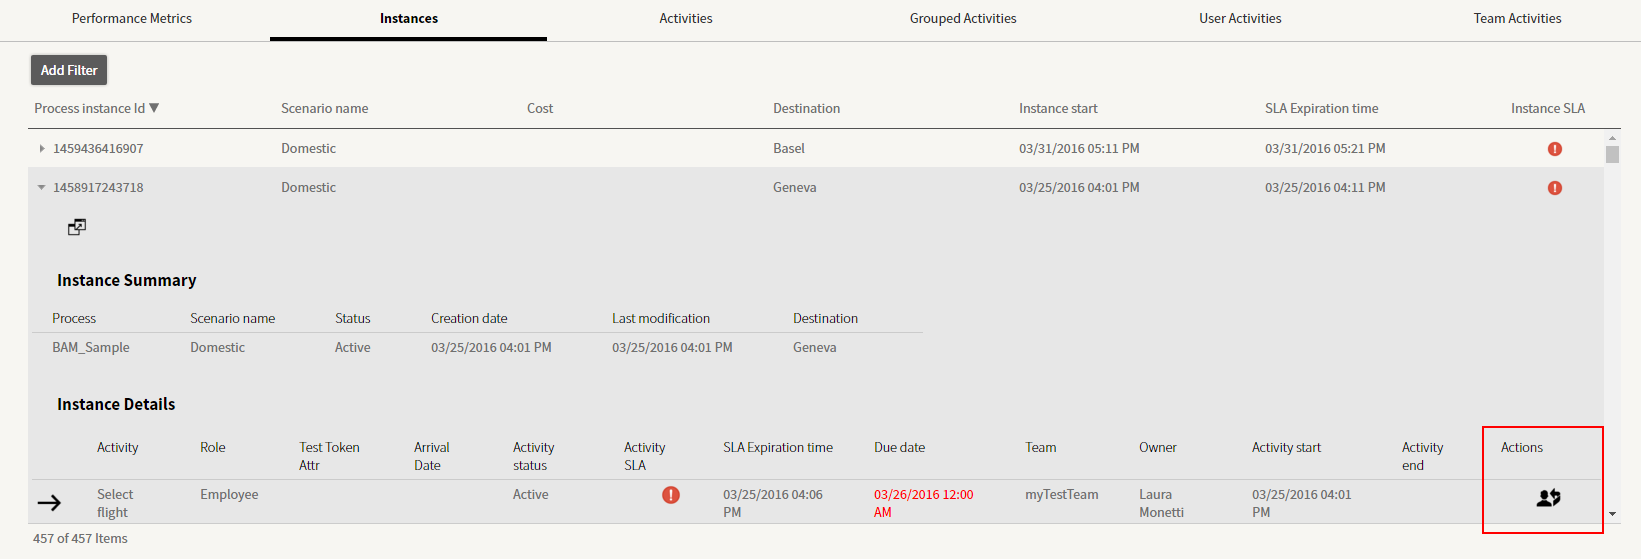
Additional activities Actions column displayed in the instance drill down view
Define an Actions column in the instance drill-down view by following these steps:
- Enable the activity actions by setting the
confcolumn for theactivityActionsEnabledentry totruein theBAM_DefaultFeaturescatalog.
BAM_DefaultFeatures catalog configuration for enabling the Actions column in the instance drill down view
2. Customize the BAM – Include – Activity Actions screen according to project-specific needs. By default, it already contains a sample "reassign" icon with no action defined, which is displayed for Active activities only. This sample action can be safely removed and is merely provided as an example of how to implement a custom action.
In the BAM – Include – Activity Actions screen, one variable is already defined: The dbRecord is a named collection of strings containing the current activity data. The BAM – Include – Activity Actions screen is included in the second table of the BAM – Include – Activity Details screen, which implements the instance drill down view.
Therefore, this included screen is rendered once for each row in the Activity Details screen activity table (i.e. once for each activity in the process instance). The variable dbRecord contains one of the records returned by the function GetInstanceActivities documented in the Functions chapter above.
Even though the actions screen can be fully customized, it is recommended that users only include a set of icons, each representing a specific action on the activity. For example view, reassign, delete, notify, etc. Using other type of components such as checkboxes or other controls is not covered as part of supported customization.
It is the developer’s responsibility to implement all the required checks in the custom actions screen to make sure that each action is only available if the activity is in an appropriate status. For example the reassign action makes sense only for activities with the status Active.
Customization Examples
Some implementation examples for the customization techniques described in the Customization Guidelines can be found in the Appway Developer Cookbook.
Here are links to available recipes:
- BAM Dashboard Customization: Add a New Chart
- BAM Dashboard Customization: Add a Scatter Plot Duration Chart
- BAM Dashboard Customization: Apply Solution Template
- BAM Dashboard Customization: Add a Custom Action
- BAM Dashboard Customization: Send Notification upon SLA Expiration
GDPR Compliance
The General Data Protection Regulation (GDPR) is an EU regulation aimed at protecting the privacy of natural persons regarding the processing of personal data and the free movement of such data. The purpose of GDPR, among others, is to strengthen and to unify data protection laws within the EU for individuals, ensuring individuals have control of their personal data.
Important! The Appway BAM extension stores data and as such it can be used to persist information on data subjects (natural persons). Implementing a data persistence strategy that is compliant with the regulations stipulated by GDPR must be guaranteed by the implementation of the Solution by the customer or entity using this product. Compliance is not inherent in any way to the product itself.
This document and the content thereof and any information derived from it is not to be construed as legal, regulatory and/or tax advice. Appway is not permitted to and will not provide any legal, regulatory and/or tax advice. Appway is also not providing an interpretation of any laws or regulations that may be applicable to any customer, prospect, or anyone, and they shall be responsible for clarifying and stipulating the legal and regulatory requirements applicable to its business. While Appway personnel providing the services may, through experience or specialized training or both, be familiar with the general regulatory environment in their capacity as information-technology and management-consulting professionals, they will work under the direction of the customer and its legal counsels regarding the specific legal and regulatory requirements under which the customer operates. The compliance of the services and work results with the applicable laws and requirements remains the sole responsibility of customer and their legal, regulatory and/or tax advisors.