FNZ Studio Feature Overview
Introduction
FNZ Studio Composition is an integrated development environment where you work as a developer.
FNZ Studio Runtime, on the other hand, is the front-end, that is, where the end-user interacts with the model created in FNZ Studio Composition. Therefore, the end-user works on the same model as the developer. This is in line with our «One-Model Approach».
All FNZ Studio Composition features are comprised in five main modules. This document lists and briefly illustrates all the features included in FNZ Studio Composition. Complex features and tasks are explained in detail in separate documents.
Legend:
- Modules
- Sub-modules
- Tabs
Solution Design
Packages
Packages bundle Business Objects (BOs) which belong together and define if and how BOs can interact with each other. Every BO resides in exactly one Package. By default, a BO is internal (private) to a Package. It can only be used in another Package if you declare it as Visible.
Packages are designed to:
- simplify the management and organization of large and complex solutions
- foster reuse across different solutions
- boost agile and parallel development for teams
- act as the high-level building blocks of a Solution.
See full information:Packages .
Translation
Access: Solution Design > Translation
This tab provides a table listing all Label Business Objects available on your instance. You can define Overriding Translations for any of these Labels (with the exception of the Labels located in the Base Package).
See full information: Languages, Labels and Translations .
Search
Access: Solution Design > Search
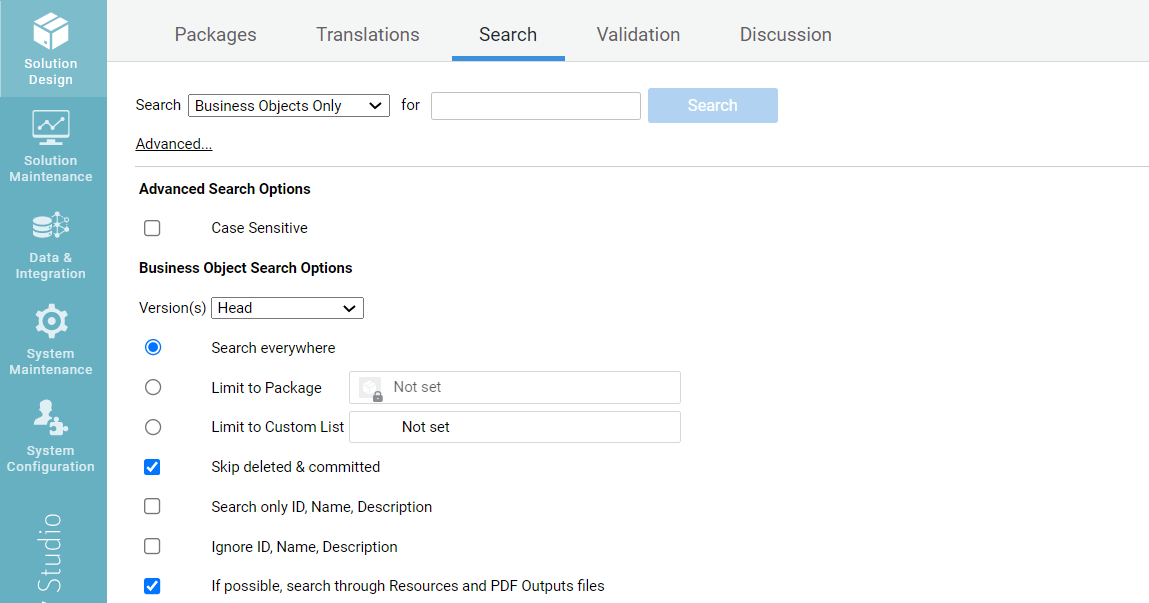
This tab allows you to search for any item in FNZ Studio Composition.
- Optionally, narrow down your search by selecting a type of item (Business Objects, Script Function, and so on) from the Search drop-down list.
- Enter an item ID, name, description or a different search term in the text field.
- Optionally, click on the Advanced button to open the Advanced Search Options. This allows limiting your search to specific Packages or Custom Lists, as well as adding other search criteria, as illustrated in the image above)
- Click on the Search button.
Validation
Access: Solution Design > Validation
This tab allows you to see which Business Objects return warnings or errors.
- Select a Business Object type and the Version for which you want to validate them from the corresponding drop-down lists, and then select the Validate button. The table displays a list of Business Objects that return warnings, errors, or for which there is some information to be taken into account.
- To display further information on the issue, click on a Business Object, and then select the Show Validation Logs button.
Activity Log
Access: Solution Design > Activity Log
Some of the main features of the Activity Log tab are:
- Search Messages: allows you to search for existing messages based on keywords.
- Active Locks: displays the list of Business Objects that are currently locked.
- Also Online: displays the list of users who are currently connected.
Solution Maintenance
Processes
Process Engine
Access: Solution Maintenance > Processes > Process Engine
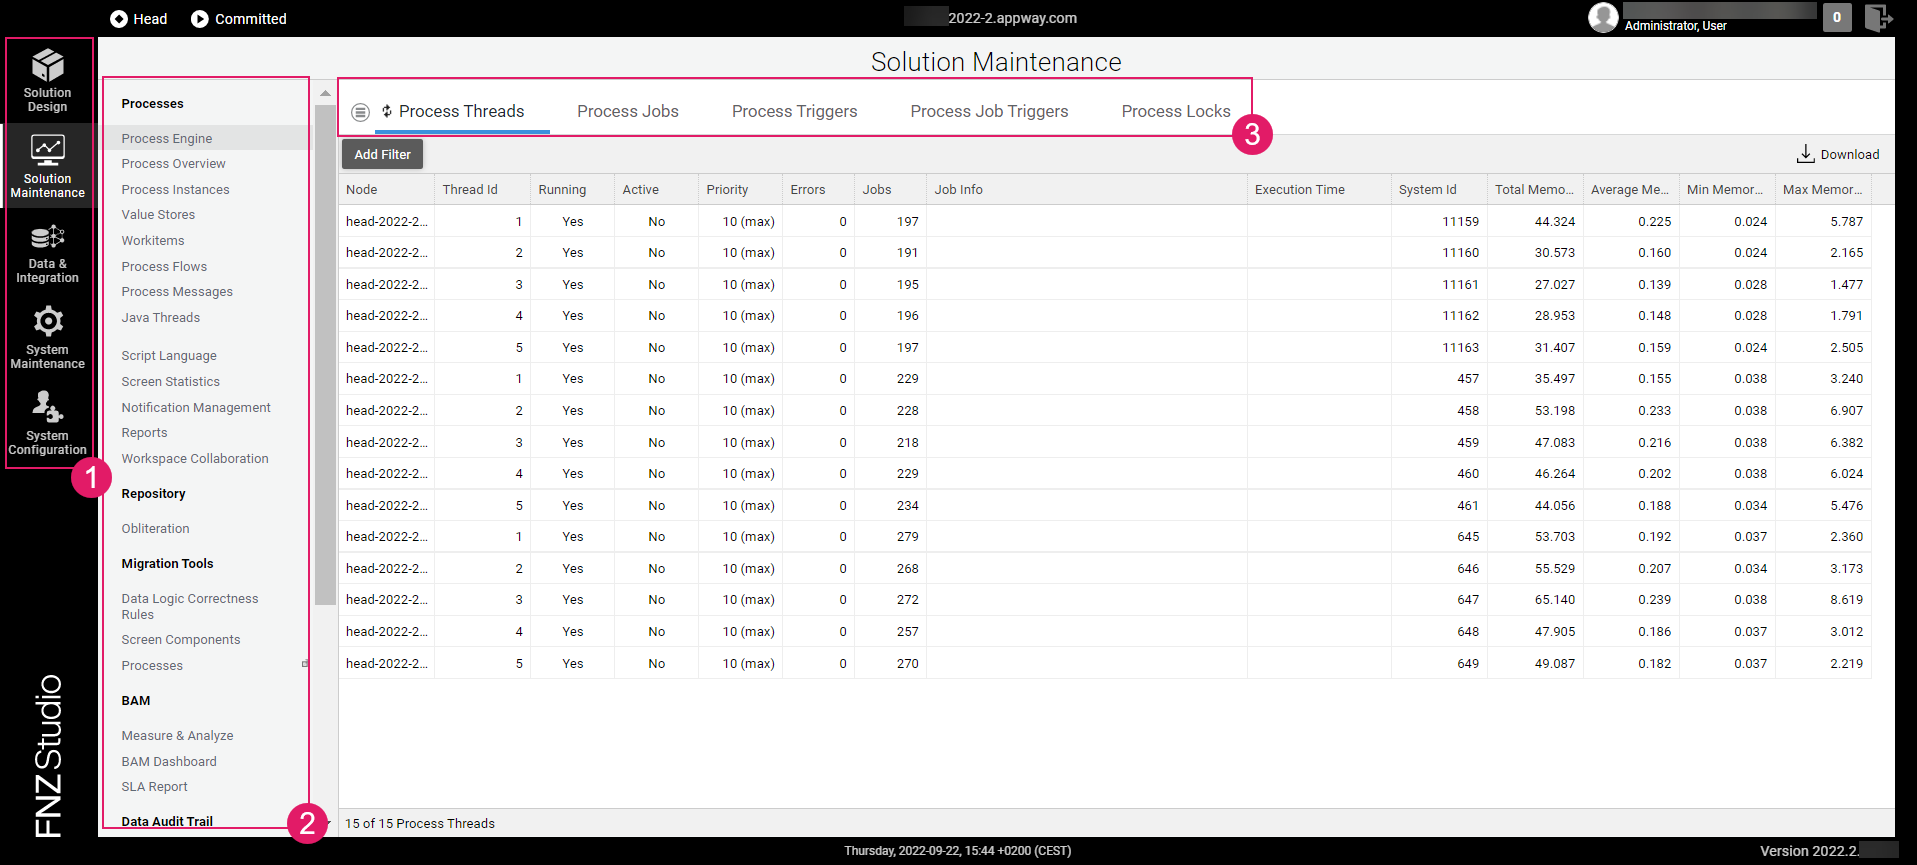
The Process Engine tab provides information on CPU execution times and the status of process threads (responsible for updating process instances).
Process Threads
Access: Solution Maintenance > Processes > Process Engine > Process Threads
This tab displays a list of Process Threads. Process Threads are a set of worker threads for background activities maintained by the Process Engine. These threads are mainly used to update Process Instances. Long-running process threads are often the reason for or a consequence of problems with process locks.
Process Jobs
Access: Solution Maintenance > Processes > Process Engine > Process Jobs
This tab displays a queue of Process Jobs created by different services and components. A Process Job is an action to be performed on a Process Instance (for example, updating a specific Process Instance). These jobs are executed by Process Threads. Whenever a Process Thread has finished executing a Process Job, it checks if the queue contains more Process Jobs. In this case, it takes one job from the queue and executes it. If there are no more jobs in the queue, the Process Thread waits for new jobs to appear.
Process Triggers
Access: Solution Maintenance > Processes > Process Engine > Process Triggers
This tab displays a list of all the committed processes that have a signal, message or timer event as a start event.
Process Job Triggers
Access: Solution Maintenance > Processes > Process Engine > Process Job Triggers
When a Process token reaches an intermediate timer event and is blocked for a certain period of time (for example, 7 days), the process engine creates a Process Job Trigger, that is, a process job with an associated execution date in the future.
A list of Process Job Triggers waiting to be processed can be seen in this tab. However, since most Process Instances do not need to be modified, and the execution of a Process Job takes only a couple of milliseconds, the queue should be empty most of the time.
Process Locks
Access: Solution Maintenance > Processes > Process Engine > Process Locks
This tab displays a list of locked Processes (if any). When a Process is locked, the FNZ Studio Runtime user is temporarily not able to move on in the Process (for example when selecting the Next button). A lock is usually released after 120-140 seconds.
Process Overview
Access: Solution Maintenance > Processes > Process Overview
This page shows statistics about running Process Instances.
- Name: shows the name of the Process (or its ID if the Process does not have a name).
- Version: shows the Process version (when it was created).
- Count: shows the total number of processes. This number is broken down into the following states:
- Ready
- Active
- Suspended
- Completed
- Canceled
- Deleted
- Sub-Processes: shows how many of the processes are sub-processes.
Process Instances
Access: Solution Maintenance > Processes >Process Instances
The Process Instance tab provides details on the Process Instances such as: ID, status, duration, memory size on disk, as well as creation and modification dates. The tab displays active Process Instances by default. However, you can edit the filter to display Process Instances with a different status.
- To perform an action on a single Process Instance (such as displaying its details, updating, canceling or deleting it), right-click on it and select the according button (Details, Update, Cancel, or Delete).
- To perform an action on a group or on all the Process Instances, open the Batch Operations menu. A list of possible actions and their descriptions is displayed.
Value Stores
Access: Solution Maintenance > Processes > Value Stores
The Platform manages all Data Entities in a container called Value Store. All the data related to a Process Instance are stored for the duration of that instance, regardless of whether the system is restarted. The data stored for that instance is deleted automatically once the Process is over.
The Value Stores tab displays a list of Value Stores currently used in the system. This tool allows a composition administrator to view the variable definitions and scopes that are defined in the Value Store. To display details about a Value Store (such as variable names and types), right-click on it and select the View button.
This happens because the Values Store sizes displayed come from the distributed map and are already serialized, but the sizes are not stored into the cluster storage. Therefore, size computation is lost after an Platfrom restart. Size computation is performed when the Value Store is saved and every time it is changed. It is cached but not persisted, therefore it is lost after a restart, resulting in the question marks. However, if the Value Store is changed again, sizes are recomputed and they become visible again.
Process Tokens
Access: Solution Maintenance > Processes > Process Tokens
Process Tokens are Tokens waiting for a Process action (for example, clicking a button) or event (for example, a message) to continue the Process execution.
Following are some of the actions you can perform on this tab:
- You can display information on the Process Instances by right-clicking on a Process Token and selecting the View Process Instance button.
- When a Token is suspended for some reason (represented in red in the Process image), you can obtain more information by right-clicking on the item and selecting the Stack Trace button.
Process Flows
Access: Solution Maintenance > Processes > Process Flows
This option displays information about the available Processes. Click on a Process to display the Process image, as well as information about Process Instances, Sub-Processes (if any).
Process Messages
Access: Solution Maintenance > Processes > Process Messages
This tab displays the message queues from the source environment. Messages can come from message events, Integration Links or script. The message must be created manually in the target environment.
You can send messages manually for testing purposes by right-clicking on a message queue and selecting the Send Message button.
To add a new queue, select Add Queue from the menu. Besides the Name and Description, you can define:
- Max Size – Indicates the maximum amount of messages the queue is intended for. Note that this limit is not enforced, i.e. the value is only displayed in the Message Queue overview for informational purposes.
- Persistent – If selected, Process messages which are set as persistent are persisted. This means that for a Process message to be persisted, two conditions must be fulfilled:
- The queue to which the message is sent must be set to Persistent.
- The message itself must also be set as persistent, e.g. by setting the
.setPersistentmethod totruewhen sending a Process message via script, or by flagging the Persistent checkbox when sending a Process message from the FNZ Studio Composition UI.
- Temporary – If selected, the queue is automatically deleted if it is empty; the deletion is performed by the 'Process Messages Maintenance' job, which runs every 5min by default.
Script Language
Access: Solution Maintenance > Processes > Script Language
For full information see: Script Language Introduction, Scripting Best Practices, Script Function Reference.
Function Statistics
Access: Solution Maintenance > Processes > Script Language > Function Statistics
A potential performance bottleneck comes from the Script Functions used in your solution. The Function Statistics tab shows the execution times and invocation number for functions such as: Script Function Business Objects, Data Class methods, API functions in the Platform, and functions in extensions.
Contexts
Access: Solution Maintenance > Processes > Script Language > Contexts
This option displays all running scripts.
In addition to execution times, the Contexts tab provides information on the elapsed time for running script code. This is useful for detecting script threads that have been running for an excessively long time.
Breakpoints
Access: Solution Maintenance > Processes > Script Language > Breakpoints
This tab displays an overview of all existing (active and disabled) breakpoints. A breakpoint is an intentional stopping place used for acquiring knowledge about a program during its execution. However, this feature must be used carefully on production systems, since a breakpoint waiting for inspection can block your system.
Prerequisite for displaying breakpoints:
To see the existing breakpoints, these must have been configured in System Configuration > Configuration Properties:
- Click on the Menu icon, and then select the Edit Server Configuration button
- Add a new line to the server configuration:
nm.breakpoints.enabled = true - Save and Close.
Inspecting breakpoints:
To inspect a breakpoint, go to the Triggered Breakpoints area, right-click on it, and then select the Inspect button.
Breakpoint sensors in System Health:
Breakpoint sensors are also displayed in System Maintenance > System Overview > Health. They detect if there are any active breakpoints set in the script code.
By clicking on the menu icon, you can access one more option:
- Start Interactive Script Editor
To open the Interactive Script Editor, click on the Menu icon, and then select the Start Interactive Script Editor button. Note that you can open it from anywhere in FNZ Studio Composition by pressing the Ctrl-Shift-I keys. This tool allows you to write scripts and execute them outside the process context. The editor has three main areas:
- The Composition Area in the center is where you can type code.
- The Console area on top contains the runtime output of your script when you execute it. An interesting feature is the code snippets library. Snippets are code fragments that you can insert into a script or around a code selection. Select a statement in your script and click on the Snippets button to select a code pattern (for example a “For Each” loop).
- The Help Area on the right displays variable definitions, validation results, function, data class descriptions and examples of how to use them.
Java Threads
Long-lasting threads need to be investigated. To do so, right-click on the 'suspicious' Process (identifiable through the Node Name and ID column details) and select the View Stack Trace button to display the Process details.
Screen Statistics
Access: Solution Maintenance > Processes > Screen Statistics
This option displays statistics about screens, such as render time, process time, and update time.
Prerequisite: In order for screen statistics to be displayed, the nm.screenstatistics.enabled parameter (System Configuration > Configuration Properties) must be set to true.
Notification Management
Access: Solution Maintenance > Processes > Notification Management
FNZ Studio Runtime notifications are alerts that inform users about specific events within FNZ Studio Runtime. Example events could include an approval request – or, if used in conjunction with Workspace Collaboration, the user receiving an invitation to join a chat, or being mentioned in a discussion.
Creating Topics
Access: Solution Maintenance > Processes > Notification Management > Topics
The Topics tab displays an overview of all topics that exist at that in time in the Platform, and lists the users subscribed to those topics. To add new topics, follow these steps:
- Click on the Menu icon at the top left and click on the Create Topic button.
- Enter at least an ID for the topic being created and click Save.
- To add or change the topic name or description at a later stage, right-click on the topic and click on the Edit Name/Description button.
- To see the topic dependencies, right-click on it and click on the Show Dependencies button.
Configuring subscriptions
You can dynamically subscribe users to topics using Script Functions and allow users to edit their subscriptions via the subscription Screen Components. However, as a developer or administrator, you can also configure topic subscriptions in FNZ Studio Composition directly. To do so, follow these steps:
- Right-click on the topic and click on the Edit Subscriptions button.
- In the dialog box:
- Select a notification delivery channel (all subscriptions are related to a channel).
- To subscribe additional users, groups, or roles to the selected topic, select them from the left panel, and then click the >> button.
- Optionally, configure excluded users. This prevents specific users belonging to a group or role from receiving notifications. To do so:
- Right-click on the desired group or role from the subscribers’ panel, and then click on the Edit excluded users button.
- Select the users to be excluded from subscriptions from the left panel, and then click on the >> button.
For full information, see Workspace Notifications
Monitoring Inboxes
Access: Solution Maintenance > Processes > Notification Management > Inboxes
The Inboxes section gives you an overview of all users with a non-empty notification inbox, including the total number of notifications in each inbox, and the number of notifications they have not read yet.
If you select the Multiple Inboxes per User feature, you see multiple entries for each user (one for every inbox). The inbox ID is composed of the user ID and the inbox type, e.g. ‘NM|alerts’ for the default user NM’s ‘alerts’ inbox. The default inbox ID is the user ID.
Deleting Notifications
The Notification Management tab allows you to delete notifications:
- To delete the notifications belonging to a specific inbox, right-click on the inbox row and click on the Delete Notifications button. This means that all references to notifications are removed from the selected inbox. After this operation, the user’s inbox is empty. The actual notification messages, however, are not deleted since they could be referenced from other inboxes.
- To delete either old or all notifications, click on the Menu icon at the top left, and click either on the Delete Old Notifications or Delete All Notifications button. This deletes the corresponding inbox entries, as well as the notification messages themselves.
The Menu icon is only visible when the Topics tab is selected.
Report
Access: Solution Maintenance >Processes > Reports
The Report section (Show System Report button) produces a report with technical information on your Solution, such as Application Version, Build information, Operating System, Java version and so on.
Repository
Obliteration
Access: Solution Maintenance > Repository > Obliteration
Obliterating old, no longer used versions of Business Objects can free up significant amounts of memory and helps keep long-running systems performant.
Change Tracking
Story Management
Access: Solution Maintenance >Change Tracking > Story Management
FNZStudio’s Change Tracking feature allows FNZ Studio developers to collect all Business Object changes related to a unit of work (change, new feature, bugfix) which, in this context, is referred to as Story.
FNZ Studio provides the Story Management module to browse all Stories and manage them, which includes adding and removing Stories as well as adding and removing changes from Stories (in case of tracking mistakes done while applying changes to Business Objects).
Migration Tools
Screen Components
Access: Solution Maintenance > Migration Tools > Screen Components
This option allows you to automatically migrate legacy Screen Components (Dropdown List and Date Picker) to newer versions.
Data & Integration
Data
Data Sources
Access: Data & Integration > Data > Data Sources
This tab lists all data sources with their state, name and description. Their state is indicated by a status icon:
- Green: indicates an active data source (available for work).
- Gray: indicates an inactive data source. The targeted database is not accessible due to configuration or network errors.
Creating a Data Source
To create a new Data Source, click on the menu icon and select one of the following options:
- Add JDBC Data Source
- Add JNDI Data Source
Set Password Encryption Key
If you want to set a password encryption key:
- From the Data Sources tab, click on the menu icon and the select the Set Password Encryption Key button.
- Enter the Master Password, and then set the New Encryption Key.
- If you are using Java Strong Encryption, you can set a password between 7 and 64 characters.
- If not, you can set a password with a maximum of 7 characters.
If a Master Password is not set, you can leave the field empty.
Integration
Integration Link Management
Access: Data & Integration > Integration Link Management
The Integration Link Business Object is the interface between the Platform and all external systems. It defines a processing flow for internal or external data.
The Integration Link Management tab displays a list of the available Integration Links and of their components. Such components, which can be both built-in or derived from extensions, receive data and trigger tasks within the Platform or in an external service. By right-clicking on an Integration Link, you open a contextual menu that allows you to perform different actions, such as:
- Displaying details about the Integration Link.
- Displaying a test tool for testing and debugging.
- Starting, restarting, disabling, or committing the Integration Link.
- Showing the Integration Link dependencies
Troubleshooting Console
Access: Data & Integration > Troubleshooting Console
The Integration Troubleshooting Console was designed to support troubleshoot various FNZ Studio integrations:
- OIDC integration
- Calls to WebAPIs
- WebServices calls
- MQ Systems
Data is collected on each cluster node and stored in memory only for a short period of time (30 minutes by default).
System Maintenance
Dashboards
System Dashboard
Access: System Maintenance > Dashboard > System Dashboard
The System Dashboard gives an overview of the current memory utilization and average system load. It also provides memory usage details for all cluster nodes, thus providing the user with a general overview of the Platform system. The System Dashboard offers more in-depth information than the Developer Dashboard system widget and the Node Inspector, since it allows you to drill down into individual nodes in a cluster.
Developer Dashboards
Access: System Maintenance > Dashboards > Developer Dashboards
The Developer Dashboard gives you an overview of the Platform installation. It shows information about the system itself, the Business Objects, and the developers who work on that system.
System Info
Access: System Maintenance > Dashboards > Developer Dashboards > System Info
- Statistics: shows a global overview of your system (number of running process, online users, and so on)
- System Info: shows the cluster you are currently on, which data sources are available to you, and so on.
- System Size in Time: gives you a quick overview of the growth of your Platform installation.
- System Health: monitors the critical aspects of the Platform installation in terms of responsiveness, performance, stability, consistency, or integrity (breakpoints, disk space, license, and so on) by showing the current sensor states in a simplified view. If a sensor has detected a critical issue, an alert bar is displayed in FNZ Studio for all users. Such an alerting mechanism offers Administrators a quick overview of the most critical issues that can occur in the platform, improving their reaction time and allowing them to implementing countermeasures. An example would be the amount of free space on the disk where data home directory is located. Many services, engines, and components save information on this disk. If the disk runs out of free space, FNZ Studio may fail to store more data. And if a power outage or a system crash occurs at the same time as this disk is out of space, everything kept only in memory is lost. It's therefore critical that you monitor this data for your Solution.
User Info
Access: System Maintenance > Dashboards > Developer Dashboards > User Info
- Online Users: shows what kinds of Business Objects were committed recently, and gives you an overview of the kinds of tasks developers are currently working on.
- Your Discussion Messages: shows the name of the users who work most frequently in FNZ Studio Composition.
- Recently Used: shows a list of the Business Objects you have used and modified recently.
- Recently Used & Changed: shows a list of Business Objects you have recently opened.
- Most Active Users: shows a list of new Discussion messages that mention you, or were published by you.
- Recent Commits: shows a list of users that are currently online on your Platform installation.
Business Object Info
Access: System Maintenance > Dashboards > Developer Dashboards > Business Object Info
- Recent Activity: gives you information on the tasks that have recently been developed.
- Open Business Objects: shows a list of Business Objects that people are currently working on, and, for each Business Object, who is working on it.
- Most Edited Business Objects: shows the Business Objects that receive most edits. This provides information on which parts of the system are the most complex.
- Business Object Types: shows what kinds of Business Objects a solution leans towards. A great number of PDF Outputs indicated that the system generates a great amount of different documents. Several Processes indicate that the system implements a complex logic. Note that Business Objects that are used in an outsized number (for example, Labels) are excluded from this widget.
- Version History Size Distribution: shows how many different versions per Business Object exist. If there are many Business Objects with a large number of versions, this is a clear indication that some cleanup process may be ongoing.
Node Inspector
Access: System Maintenance > Dashboards > Node Inspector
The Node Inspector allows you to monitor individual cluster nodes. It displays data for each node used in your cluster installation. Therefore, performance data for a node is available without having to connect to that node.
To display further data than the data shown by default, expand the flap on the right and select the desired values.
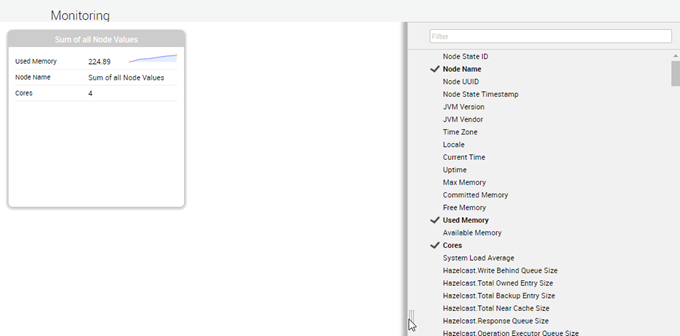
Information available via the Node Inspector includes:
- The number of serialized objects that are owned by a node in the map, as well as the number of entries that are backups of data objects from other nodes.
- The number of read and write operations on the data maps, along with the CPU execution times for these operations.
- The number of dirty entries in each map, indicating how many entries have not been backed up to persistent storage.
- The number of cache hits on the Near Cache of each node.
- The number of cache misses on the Near Cache of each node.
System Overview
Overview
Access: System Maintenance > System Overview > Overview
The overview provides the following information on a per-node basis:
- General Information – Details on the used Platform version, build information, data home location, and server time and time zone.
- Licensing Information – Type and validity of the used license file.
- Processors – Number of CPU Cores.
- Memory – Memory usage statistics for the Java Virtual machine.
- Disk Space – Available and usable disk space on the partition with Data Home.
By clicking on the menu icon, you can access three more options:
- Show System Report (see Report).
- Show Available Time Zones From the Overview tab, click on the menu icon and select the Show Available Time Zones button to see the time zones available on your server.
- Request Garbage Collection The Request Garbage Collection asks the Java Virtual Machine (JVM) hosting Platform to check its memory usage and free as much memory as it can. A JVM cannot be forced to immediately run a garbage collection. The JVM may react immediately, with some delay, or even not run a garbage collection at all. The effect of a garbage collection can usually be seen when looking at the charts for how much memory the JVM is using. You can read this information from the Memory Used widget (System Maintenance > Dashboards > System Dashboard):
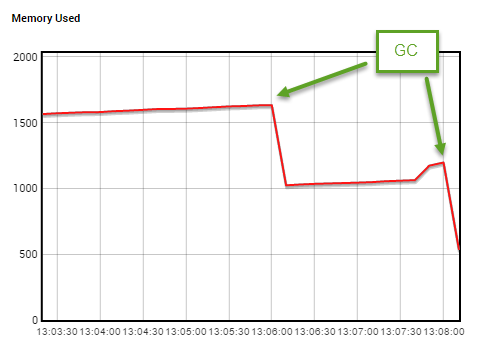
For more information, see Memory Disk Utilization
Health
Access: System Maintenance > System Overview > Health
System Health is a built-in Platform service that constantly monitors the critical aspects of an Platform installation in terms of responsiveness, performance, stability, consistency, or integrity. The System Health tab gives an alert status for a variety of sensors, among which:
- Long-running threads
- Low disk space
- Low heap space or memory leaks
- Overdue jobs
- Whether the number of nodes is lower than a specified threshold value
Although customers tend to have third-party monitoring solutions installed, the Platform’s built-in System Health service represents a safety net, with the advantage of being closely integrated with the Platform. This service, in fact, can access internal information and can use Platform-specific channels to notify users about potential problems.
Report
Access: System Maintenance > System Overview > Report
This tab allows you to open a report containing technical information on the Platform installation and environment . Click on the Show System Report button to open the report on a different tab.
User Sessions
Access: System Maintenance > System Overview > User Sessions
This tab provides information on the user sessions for the current date.
System Locking
Access: System Maintenance > System Overview > System Locking
Locking the application is recommended, for example, as a best practice when deploying an extension (see Managing Extensions).
Click on the Lock System button. The lock stays active until the user's session that started the lock expires, or until the lock is deactivated by manually unlocking the application through the Unlock Application button.
Job Scheduling
Access: System Maintenance > System Overview > Job Scheduling
The Job Scheduler monitors all the processes that run in the background and controls different parts of the system, such as the process engine or clean-up jobs. It also allows you to manage such jobs: you can, for example, pause and resume them or set the time at which they should be triggered. To read a brief description of the function of a job, click on the arrow to the left of the job name.
Logging
System Maintenance > System Overview > Logging
Settings
Access: System Maintenance > System Overview > Logging > Settings
This tab displays a list of possible log configurations and a description of each of them.
Log Viewer
Access: System Maintenance > System Overview > Logging > Log Viewer
The Log Viewer displays all the log messages created by Platform or the solution.
Consider the following information:
- The table displays the logs generated in the previous 30 minutes by default. However, you can change the date and time by clicking on the Date/Time is during the last [30 minutes] button.
- You can filter all the collected log messages by date and time, log level, log message text, node name, thread name, and logger name. Moreover, you can add additional columns. To do so, click on the Edit Columns button, and add the column name in the empty field.
- You can display more information on the log, as well as a stack trace, by clicking on the arrow icon.
- You can display and download a text version of log messages by selecting the relevant messages and clicking the Show Plain Text button.
There are different levels of severity: Debug, Info, Warn, Error, Fatal.
Log Files
Access: System Maintenance > System Overview > Logging > Log Files
This tab displays a list of log files modified on the current day (default option). Each log file contains a list of log messages.
Consider the following information:
- You can open the log file by double-clicking on the file name.
- You can change the default display date by clicking on the Modified is [date] button.
Loggers
Access: System Maintenance > System Overview > Logging > Loggers
This tab displays a list of logger objects used to log messages for the application components.
Consider the following information:
- You can change the logger level (DEBUG, INFO, WARN, ERROR, FATAL) by right-clicking on the logger and then selecting the Edit button. Select the information or error level from the drop-down list.
- You can set a threshold level for each logger by clicking on the menu icon and then selecting the Threshold button. This means that the messages logged by this logger that do not reach the level set are ignored.
- You can create a new logger by clicking on the menu icon and then selecting the Create button. Select the logger level from the drop-down list. You can deselect the Additivity check box to prevent the log messages from being propagated to the parent loggers.
Appenders
Access: System Maintenance > System Overview > Logging > Appenders
This tab displays the existing appenders and their properties. The appenders are defined by configuration and cannot be created through this option. The default logger appenders are:
- Clusterlog: Consolidates the logs from all the Platform nodes. These logs are not persisted and stay in memory only for a limited time. The lifetime of a Cluster Log entry is defined using the "nm.cluster.log.eviction.ttl" configuration property.
- Dbglog: Logs are written to the "/logs/debug.log" file of the Platform node. This logger uses the "RollingFileAppender" rolling strategy. The maximum file size is set to 4MB. It is possible to have up to 4 log files: this means that, once the fourth file has reached 4 MB in size, the first one is overwritten with new data.
- Errlog: Logs are written to the "/logs/error.log" file of the Platform node. This logger uses the "DailyRollingFileAppender" rolling strategy.
- Stdlog: Logs are written to the system standard output. The appender uses the log4j "ConsoleAppender" rolling strategy.
Caches
the Platform objects are stored in distributed maps and in a node’s local cache to allow faster access and to boost the performance of your application. The Maintenance tab contains three types of caches: System, Cluster, and Application caches.
System Caches
Access: System Maintenance > Caches > System Caches
This tab displays a list of system caches. By clicking on the arrow icon, you display a description of each cache and information on the implications of flushing it.
- To flush a specific cache, right-click on it and select the Flush Cache button.
- To flush all the system caches, click on the menu icon and then select the Flush All Caches button.
Cluster Cache
Access: System Maintenance > System > Cluster Cache
The Cluster Cache entries are created with the function ClusterCacheStore. It is also possible to have Cluster Cache entries created by an extension. For example, SOAP errors generated by the WebServices Extension extension are written in the Cluster Cache.
Application Cache
Access: System Maintenance > System > Application Cache
The Application Cache is local to each node and populated with the CacheStore function.
If a retention expression is specified for the CacheStore function, the entry is kept in the cache as long as the retention expression is true.
System Statistics
Memory Usage Statistics
Access: System Maintenance > System Statistics > Memory Usage Statistics.
Memory Usage Statistics allow you to avoid stability and performance issues caused by high memory consumption. Knowing how memory consumption is distributed is essential for optimizing the Solution you have developed. In detail, this information can help you perform tasks such as:
- Tuning configuration options (such as eviction, near caches, and so on)
- Using the right components
- Caching only the necessary data
The concept behind Memory Usage Statistics is to identify the areas in which data is stored for a long period of time (e.g. Distributed Maps, Application Caches, and so on) and compute their sizes. In order to collect this data, a feature called Memory Holder is employed. The following information is available on the Memory Usage Statistics screen in FNZ Studio Composition, on the following tabs:
- Memory Holders – Information such as the Memory Holder name (Distributed Maps, etc.), date and time at which the memory data was last updated, amount of memory taken, and so on.
- Memory Pools – Memory area where data is stored. The information available here is:
- Used memory: amount of memory currently used.
- Committed memory: amount of memory that is guaranteed to be available by the Java virtual machine.
- Max memory: maximum amount of memory that can be used for memory management.
Note: Old Generation is where data is stored for the longest time.
- Unaccounted Memory Usage – Amount of memory represented by the difference between the size of the Old Generation and the total memory that was computed. The data displayed is not computed in real time. The Memory Usage job computes and caches this data every hour. However, you can run this job manually if you want to see updated data. Large quantities of Unaccounted Memory are often caused by the fact that Garbage Collection has not cleaned memory yet. If you want to request Garbage Collection and then re-trigger memory computations, you can click on the Request Garbage Collection and Update Memory Holders and Memory Pool Stats button.
Repository Statistics
Access: System Maintenance > System Statistics > Repository Statistics
This option includes three different types of statistics: Business Object Types, Version Distribution, and Data Home Sizes.
Business Object Types
Access: System Maintenance > System Statistics > Repository Statistics > Business Object Types
This tab displays information on the types of Business Objects included in your installation. It provides data on: the number of Business Objects per type, the absolute and average number of versions per each Business Object type, the number of deleted and uncommitted Business Objects.
Version Distribution
Access: System Maintenance > System Statistics > Repository Statistics > Version Distribution
This tab allows you to check the version distribution in the repository statistics.
The below image is an example of Version Distribution statistics, which are interpreted in the following way:
- 34 Data Logic Business Objects (39.53%) have only 1 version.
- 6 Data Logic Business Objects (6,98%) have 2 versions.
- 35 Data Logic Business Objects (40,7%) have 3 or 4 versions.
- 6 Data Logic Business Objects (6,98%) have between 5 and 8 versions, and so on.
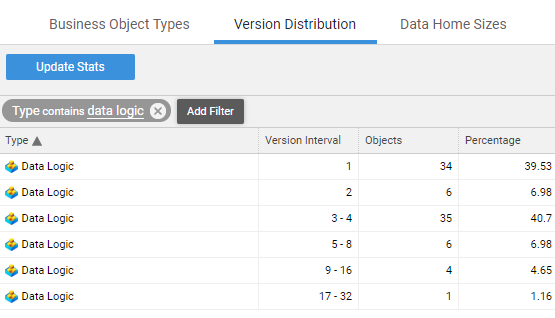
Version Distribution statistics can give you insights on Processes that are not working as expected. For example, the presence of Label Business Objects with more than 50 versions could be caused by Labels being automatically recreated or imported at every restart.
Data Home Sizes
Access: System Maintenance > System Statistics > Repository Statistics > Data Home Sizes This tab provides information about disk consumption for a node's local file system and for the cluster file system. The absolute and percentage values of disk consumption allow you to understand which folder/s have become excessively large.
Serialization Statistics
Access: System Maintenance > System Statistics > Serialization Statistics
The Serialization Statistics module provides information on how often data serialization is performed in the Platform and shows the overall time spent in serializing and deserializing data. Most data, such as Process Data and Business Objects, is stored in distributed maps, which are partitioned among all cluster nodes. Whenever some data item is written to a distributed map, the Platform first serializes and compresses that item. Likewise, whenever some data item is read from a distributed map, that item is decompressed and deserialized.
The data collected and displayed in the Serialization Statistics provides information on the usage of CPU resources for serialization/deserialization. This also allows you to understand whether some data (such as large value stores) use up excessive resources.
I/O Statistics
Access: System Maintenance > System Statistics > I/O Statistics
The I/O Statistics feature in FNZ Studio Composition keeps track of all read, write, and other operations (for example, delete operations or listing all existing keys) performed on disk. Specifically, it displays an overview of the operations performed since the statistics were last reset (or the system restarted).
CPU Statistics
Access: System Maintenance > System Statistics > CPU Statistics
This tab provides detailed CPU performance information.
Prerequisite: For the CPU Statistics table to be populated, statistics must be enabled. The nm.statistics.cpu.enabled configuration property (System Configuration > Configuration properties) must be set to true.
Work Units
Access: System Maintenance > System Statistics > CPU Statistics > Work Units
On this tab, the information is organized by source of work in the system: HTTP request threads, scheduled jobs (e.g. memory space checkers, process update engine, etc.), core tasks triggered by process instances, and so on.
Threads
Access: System Maintenance > System Statistics > CPU Statistics > Threads
This tab provides information on CPU execution times for threads.
HTTP Tracing / Network Statistics
Access: System Maintenance > System Statistics > HTTP Tracing / Network Statistics
This option allows you to collect statistics on HTTP requests. It gathers information on:
- Which components are involved in request processing.
- The time spent by each component to process a request.
This information allows the Platform administrators to detect performance bottlenecks.
The HTTP Tracing window in FNZ Studio Composition:
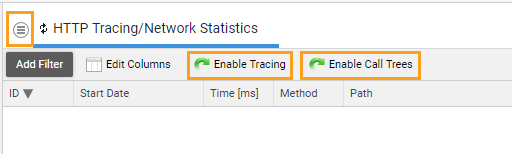
Available options include:
- Enable Tracing Select to collect static information about an HTTP request, such as URL, user ID, client IP, parameters, or headers. Tracing is disabled by default.
- Enable Call Trees Select to collect information about time spent processing in individual engines and the Platform components, such as Screen processing, Expression Language, or Script Functions. Call Trees are disabled by default.
- Filter Pattern Settings
If tracing is enabled, you can set up to four filters to determine which requests are traced. To do so, click on the menu icon and select Filter Pattern Settings. The four filters are:
- URL Patterns – Limits tracing to URLs that match the specified patterns.
- User Id Patterns – Limits tracing to a specific list of user IDs.
- Client IP Patterns – Limits tracing to requests coming from the specified client stations.
- Screen ID Patterns – Limits tracing to Screen IDs that match the specified patterns.
Note:
- Filter settings are reset after a server restart.
- Filter fields without a value are considered as disabled.
- Delete HTTP Request Data To delete all the HTTP requests displayed, click on the menu icon and select Clear All.
Web API Statistics
Access: System Maintenance > System Statistics > Web API Statistics
The Web API Statistics tables provides an overview of the number of requests made to each Web API and the associated payload size of requests and responses.
Cluster Tools
Hazelcast Members
Access: System Maintenance > Statistics > Hazelcast Members
The Hazelcast Members table displays a list of all members of the Hazelcast cluster.
Hazelcast Events
Access: System Maintenance > Statistics > Hazelcast Events
The Hazelcast Events table shows all events recorded on all cluster nodes, not only the events recorded on the current node.
Hazelcast Maps
Access: System Maintenance > Statistics > Hazelcast Maps
Three tabs providing detailed information on distributed maps are available in the Hazelcast Maps window: Hazelcast Map States, Hazelcast Map Operations, Hazelcast Map Configurations.
Hazelcast Locks
Access: System Maintenance > Statistics > Hazelcast Locks
Two tabs providing detailed information on distributed locks are available in the Hazelcast Locks window: Hazelcast CP Locks; Hazelcast Map Locks.
System Configuration
Users, Groups and Roles
Access: System Configuration > Users/Groups/Roles.
Users, Groups, and Roles allow you to assign different tasks to each participant according to their responsibilities. A Group is a collection of Users with common characteristics. A Role is an area that can be managed by certain Users.
For example, you can have the following participant categories:
- User: John Smith
- Group: Zurich Office
- Role: Front Office
For full information, see .Users, Groups and Roles
Configuration Properties
Access: System Configuration > Configuration Properties
Configuration properties are related to backend code. They allow you to customize your Platform (Core) Solution, but they can also be used by developers to adapt solutions to their necessities.
All properties are flattened and merged in the following order:
- Content properties
- Java properties
- Server properties
- Memory properties
- Environment properties
Extensions
Access: System Configuration > Extensions
For a full list of available Extensions, see List of Extensions. For best practices on how to deploy extensions, see Managing Extensions
This tab displays a list of all the permanent and restartable extensions currently available on your Platform.
The interline available for each extension provides information about the extension build date and dependencies, as well as deprecation information (if relevant).
Actions you can perform here include:
-
To upload an extension to the Platform, select Upload Extension from the menu.
-
To start, stop, configure, download, or delete an extension, right-click on the extension and select the corresponding menu item from the context menu.
-
To specify the extension's behavior when the Platform is started, right-click on the extension and select the desired context menu item (the setting for each extension is displayed in the At Startup column of the list of extensions):
-
Run At Startup – The extension is started when the Platform starts, regardless of if the extension was stopped or started when the Platform shut down.
-
Do Not Run At Startup – The extension is NOT started when the Platform starts, regardless of if the extension was stopped or started when the Platform shut down.
-
Preserve Current State (default) – If the extension was running before the Platform was shut down, it is started when the Platform starts, otherwise it is not started.
Email Configurations
Access: System Configuration > Email Configurations
Default incoming and outgoing configurations are added automatically and cannot be removed. However, you can edit them or add new ones by clicking on the menu icon and clicking on the Add new Outgoing Mail Configuration or the Add new Incoming Mail Configuration buttons.
Moreover, the Mail Extension provides advanced features which are not included in the Platform core version (such as email sending, integration link components that receive email, Data Classes to represent email objects, functions to send email using SMTP protocol, and functions to get email from a POP3 or SMTP mailbox).
-
Passwords, Keys & Certificates
Access: System Configuration > Passwords, Keys & Certificates
The Passwords, Keys & Certificates module in FNZ Studio is a centralized interface to manage all required security credentials within a given FNZ Studio environment (Secrets Management)
FNZ Studio Composition allows storing secrets such as:
- Passwords and secrets
- Public-Private Key Pairs (used for mTLS, signing, and so on)
Moreover, it allows storing:
-
Trusted Certificates (third-party certificates trusted by FNZ Studio)
-
Symmetric Keys
For full information, see Secrets Management Framework.
Licenses
Access: System Configuration > Licenses
License File
Access: System Configuration > Licenses > License File
This tab displays information on the licenses that are currently active on the server. Moreover, it allows you to perform the following actions:
-
Replace License: allows you to upload a different license file to replace the current one (for example, when it expires).
-
Show License File: displays a text file containing the license properties.
To install a license file, see License File Installation.
Licensing Assignment Rules
Access: System Configuration > Licenses > Licensing Assignment Rules
This tab allows you to set a rule to assign licenses only to those users who meet some specific requirements (for example, users who belong to a certain group or have a certain role).
To create a licensing assignment rule, follow these steps:
-
Click on the menu icon on the top left, and then click on the New Rule button. A rule is automatically created with default values.
-
To edit the newly created rule, right-click on the corresponding row and choose the Edit button.
-
Fill in the Condition field with the desired rule, and then select an option from the Access License Package dropdown list.
-
If you have more than one rule and you want to set a priority list, you can move them up and down by right-clicking on the corresponding row and selecting either the Move up or Move down buttons.
For full information, see Licensing Assignment Rules
Licensing Assignment Statistics
Access: System Configuration > Licenses > Licensing Assignment Statistics
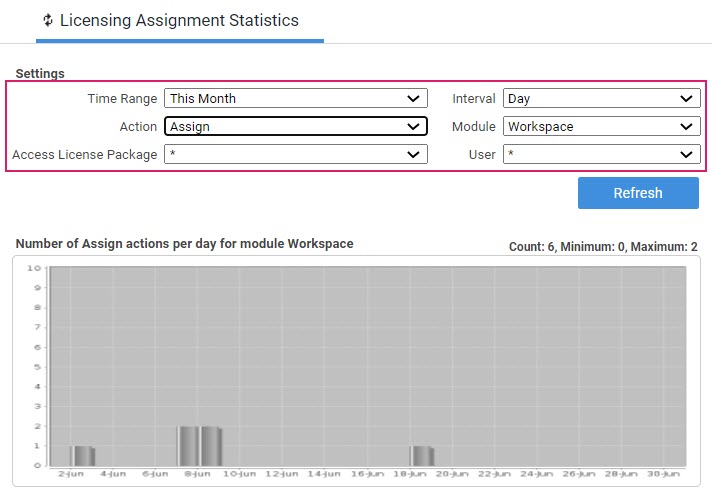
This option displays statistics on license assignments.
The upper chart is connected to the filter settings and is used to show the number of actions (assign, release, unbind or deny), aggregated over a given interval (day, week, …), for a given time range (this month, last month, …), and some more filter settings.
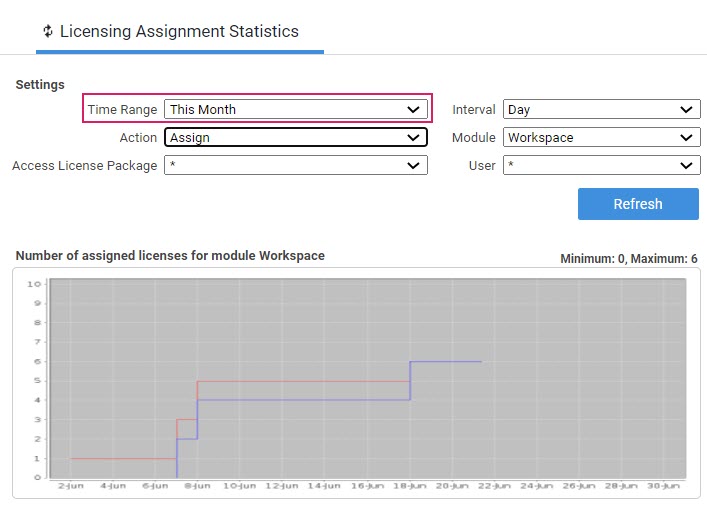
The chart at the bottom is independent of the filter settings, except for the Time Range filter. It shows the accumulated number of active (assigned but not yet released or unbound) access licenses. It can be thought of of as a counter starting at the beginning of the license history. For every assign action, the counter is incremented by one (there is now one more assigned license), and for every release or unbind, the counter is decremented by one. By doing this for the complete history, one can see the number of assigned licenses at any day in the past.
-
The red line represents the maximum number of assigned licenses for any day.
-
The blue line represents the minimum number of assigned licenses for any day.
Licensing History
Access: System Configuration > Licenses > Licensing History
This tab displays information on all the action/s performed on licenses on a specific date. For example, you can view an overview of all the licenses released on a certain day.
Data are filtered by the current date by default. However, you can change the date by clicking on the Date is button.
Licensing Report
Access: System Configuration > Licenses > Licensing Report
This option allows you to download a log file containing license information for a specific month or period of time.
The screen displays an entry for each month (for example, 2016-12).
You can also download a file containing the logs from the previous year by clicking on the Menu icon and selecting the Download Last Year Reports button.
For full information, see Licensing Reports
Other Features
Memory Allocation Statistics
Memory Allocation Statistics provides information on the quantity of (short-lived) memory allocated to perform operations such as: running Processes and jobs, rendering Screens, executing a Script, and so on.
This functionality is enabled/disabled by the system property nm.statistics.memoryallocation.enabled (default value: true).
Memory Allocation Statistics are tracked and reported in various FNZ Studio Composition Sub-moduless:
-
Script Functions (Solution Maintenance > Script Language > Function Statistics)
-
Process Threads (Solution Maintenance > Process Engine > Process Threads)
-
Java Threads (Solution Maintenance > Java Threads)
-
HTTP Tracing (System Maintenance > HTTP Tracing)
-
Scheduled jobs (System Maintenance> Job Scheduling)
-
Screens (Solution Maintenance > Screen Statistics)
Memory Allocation data is also collected for Function Call Statistics, Job Statistics, and Screen Statistics by the StatisticsCollector Extension.
The above-mentioned modules collect Memory Allocation Statistics in the following table columns:
-
Memory Allocation (MB): Allocated memory (in MBs) in each HTTP thread, or other.
-
Total Memory Allocation (MB): Allocated memory (in MBs) to execute all operations (e.g. Script Function calls, Job executions, and so on).
-
Average Memory Allocation (MB): Average memory allocated per operation.
-
Min Memory Allocation (MB): Minimum memory allocated to execute an operation.
-
Max Memory Allocation (MB): Maximum memory allocated to execute an operation.
Note that the MemoryAnalysis Extension contains the Memory Allocation Widget Screen Component, which can be used to track the memory allocation in HTTP requests while developing Solutions.